Most founders track revenue and churn. Far fewer track customer lifetime value, which means they’re making acquisition, pricing, and retention decisions with only half the picture. If you’ve ever wondered whether that $49 plan is actually profitable after support costs and churn, or whether doubling your ad spend makes sense, CLV is the number that answers those questions.
This article covers what customer lifetime value actually is, every major formula you need, and how to use CLV data to make smarter decisions on pricing, channels, and product development. If you want a deeper primer on the concept before diving into the math, understanding your customer lifetime value is a good starting point.
Launch Your App Today
Ready to launch? Skip the tech stress. Describe, Build, Launch in three simple steps.
BuildTL;DR: Customer lifetime value (CLV) is the total net revenue a business expects from a single customer over their entire relationship. According to Bain & Company, a 5% increase in customer retention can increase profits by 25% to 95%. The basic CLV formula is: Average Purchase Value x Purchase Frequency x Average Customer Lifespan. The real power is in the ratio: aim for a CLV to CAC ratio of at least 3:1 to build a sustainable business.
What Is Customer Lifetime Value and Why Does It Actually Matter?
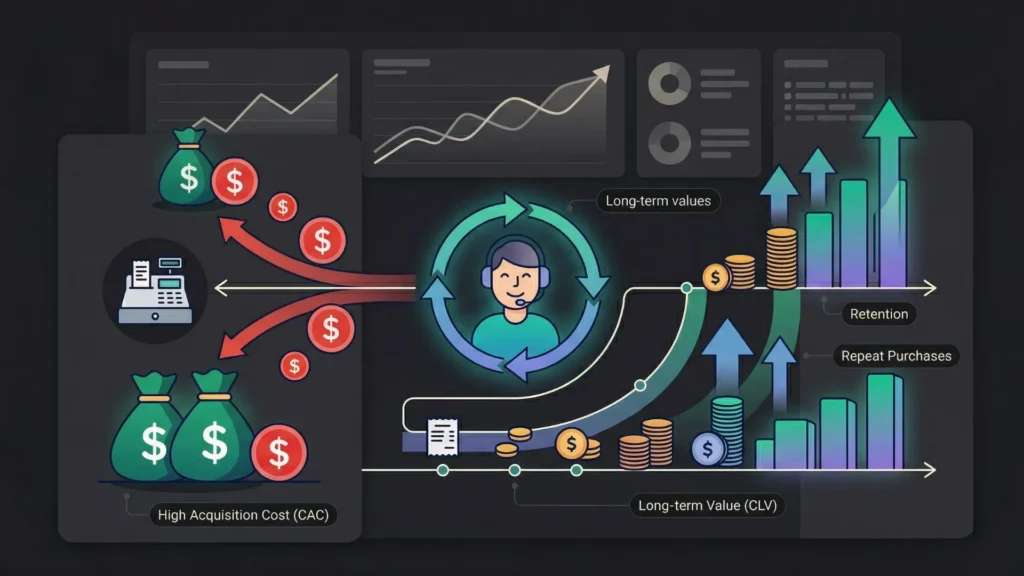
Customer lifetime value is the total revenue you can expect from one customer account over the full length of your relationship with them. It tells you how much a customer is worth in dollar terms, not just on their first purchase. According to research from Harvard Business Review, acquiring a new customer costs 5 to 25 times more than retaining an existing one (HBR, 2014). That gap is exactly why CLV matters: it shifts your thinking from “how do I get more customers” to “how do I get more value from the right customers.”
CLV is also the anchor metric for calculating whether your marketing budget makes sense. Spend $200 acquiring a customer worth $150, and no amount of growth will save you. Spend $200 acquiring a customer worth $1,200, and you have a business worth scaling.
Most early-stage founders treat CLV as a post-Series A metric, something to care about once you have volume. That’s backwards. Calculating CLV at 50 customers reveals structural problems in your pricing or retention that, fixed early, compound into serious advantages. Wait until you have 5,000 customers, and the fix costs ten times more.
When you’re using a tool like imagine.bo to build and iterate your product, CLV thinking also shapes your feature roadmap. Features that extend customer lifespan or increase purchase frequency have compounding financial impact. Features that just add complexity without affecting retention or revenue do not.
The Core Customer Lifetime Value Formula (and When to Use It)
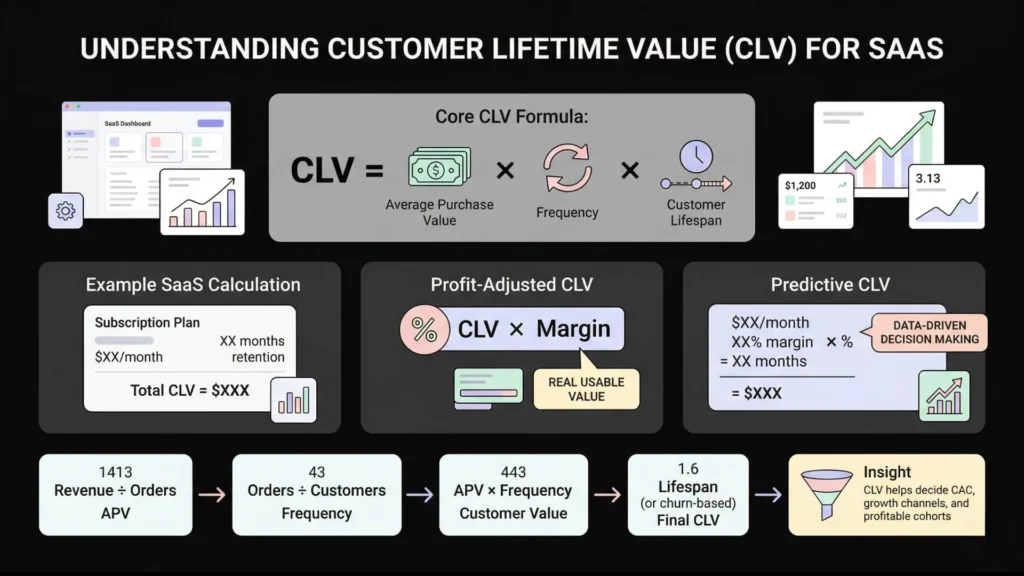
The simplest CLV formula is the one you’ll actually use, and it’s accurate enough to make real decisions. Average Purchase Value, multiplied by Purchase Frequency, multiplied by Average Customer Lifespan, gives you a baseline CLV figure. According to Shopify’s business analytics documentation, this three-variable model is the most widely used CLV formula among small and mid-sized businesses (Shopify, 2024).
Basic CLV Formula:
CLV = Average Purchase Value x Purchase Frequency x Average Customer Lifespan
Example: A SaaS tool charges $49 per month. The average customer stays for 14 months. There is one purchase per month.
CLV = $49 x 12 x 14 = $8,232 per year… wait, let’s keep the units consistent. CLV = $49 x 1 x 14 = $686
That $686 is the gross CLV for a $49/month customer with 14-month average retention.
The Profit-Adjusted CLV Formula
Gross CLV is a starting point, but the number that actually drives decisions is net CLV, which accounts for your margins.
Net CLV = (Average Purchase Value x Purchase Frequency x Gross Margin %) x Average Customer Lifespan
If your gross margin is 70% on that $49 plan:
Net CLV = ($49 x 1 x 0.70) x 14 = $480.20
That $480.20 is the maximum you can rationally spend acquiring a customer before you start losing money. Your actual target spend is a fraction of that.
The Predictive CLV Formula
For subscription businesses with enough data, the predictive formula is more accurate.
Predictive CLV = (T x AOV x AGM x ALT) — where T = average monthly transactions, AOV = average order value, AGM = average gross margin, ALT = average customer lifespan in months
If you’re running a no-code SaaS on imagine.bo’s Pro plan at $25/month and your app charges users $29/month, with a 75% margin and 18-month average retention, your predictive CLV per user is $391.50. That means your break-even CAC is around $130 before you’re in the red, giving you a concrete number to take to any paid channel.
This is the kind of calculation that helps you decide whether to validate your startup idea before spending on acquisition or go straight to a growth channel.How to Calculate Your CLV Step by Step
Knowing the formula is different from running the calculation on your own data. Here are the exact steps to get a real CLV number, not a theoretical one. According to Profitwell’s 2023 SaaS Benchmarks Report, companies that track CLV monthly grow 1.5x faster than those that calculate it only annually (Profitwell, 2023).
Step 1: Calculate Average Purchase Value
Take total revenue from a time period and divide it by the number of orders in that period. If your app generated $12,000 in the last 12 months from 300 transactions, your APV is $40.
Step 2: Calculate Purchase Frequency
Divide total number of orders by the number of unique customers in the same period. If those 300 transactions came from 120 customers, frequency is 2.5 purchases per customer per year.
Step 3: Calculate Customer Value
Multiply APV by Purchase Frequency. In this case: $40 x 2.5 = $100 per customer per year.
Step 4: Calculate Average Customer Lifespan
This is where most founders guess. Don’t. Take the average length of time between a customer’s first and last purchase across your churned customers. If you haven’t had enough churn to measure this, use a retention rate proxy: Lifespan = 1 / Monthly Churn Rate. A 7% monthly churn rate implies an average lifespan of about 14.3 months.
Step 5: Multiply
CLV = Customer Value x Average Customer Lifespan = $100 x 1.19 years = $119 (annual basis) or $100 x 14.3 months / 12 = $119.
Now segment this by acquisition channel, pricing tier, or user type. That segmentation is where CLV gets useful.
Founders using imagine.bo to build SaaS products often discover in this step that their free-tier users have a surprisingly high conversion rate to paid, making the apparent “zero revenue” cohort actually one of the highest CLV cohorts after 6 months. The calculation catches what your intuition misses.
Building a proper growth funnel with no-code tools becomes much easier once you know which cohorts are actually worth funneling more resources into.
What’s a Good CLV to CAC Ratio?
A 3:1 CLV to Customer Acquisition Cost ratio is the widely cited benchmark for sustainable growth. For every dollar you spend acquiring a customer, you should get back at least three dollars in lifetime value. According to data from First Page Sage’s 2024 CLV Benchmark Report, SaaS companies with a CLV:CAC ratio below 2:1 consistently report cash flow problems within 18 months of scaling paid acquisition (First Page Sage, 2024).
A ratio of 1:1 means you’re breaking even on acquisition, with nothing left for operations, development, or support. A ratio of 5:1 or higher might suggest you’re underinvesting in acquisition and leaving growth on the table.
Benchmark CLV:CAC ratios by business type (First Page Sage, 2024):
- B2B SaaS: 3:1 to 5:1
- E-commerce (subscription): 2.5:1 to 4:1
- Consumer apps (freemium): 1.5:1 to 3:1
- Professional services platforms: 4:1 to 7:1
If your ratio sits below 2:1, the fix is usually one of three things: lower CAC through better-converting channels, increase CLV through retention improvements, or reprice. The CLV formula tells you which lever is weakest.
The ratio benchmark assumes a static CAC. But for founders using AI builders like imagine.bo, CAC on organic and SEO channels is substantially lower than paid, meaning a 2:1 ratio on organic is actually more profitable than a 3.5:1 ratio on paid search after you account for the spend. Adjust your ratio target by channel, not just overall.
If you’re building a product and want to think through questions every founder should ask before scaling acquisition, CLV:CAC should be near the top of that list.
How to Use CLV to Make Better Business Decisions
CLV becomes genuinely useful when it changes what you do, not just what you know. Companies that use CLV to guide acquisition spend are 60% more likely to hit their revenue targets than those that rely on channel-level ROAS alone, according to McKinsey’s 2024 Growth Analytics Report (McKinsey, 2024).
Acquisition channel decisions: Calculate CLV by channel. If Google Ads customers have a 12-month average lifespan and referral customers have a 26-month lifespan, your referral program deserves more investment than your media budget suggests. Running a referral program for business growth is much easier to justify when you have the CLV data backing it.
Pricing decisions: If your $29 plan has a CLV of $350 and your $99 plan has a CLV of $1,800, that’s not just an upsell opportunity. It’s a signal to rethink whether $29 is the right entry point or whether the segment buying it is actually your best customer profile.
Product decisions: Features that increase purchase frequency or extend retention directly increase CLV. Features that reduce support volume decrease your cost base, which improves net CLV. When you’re deciding what to build next, map every potential feature to one of those two levers.
Support and success investment: Knowing a customer’s CLV tells you how much you can spend keeping them. A $1,200 CLV customer justifies a 30-minute onboarding call. A $90 CLV customer probably doesn’t.
When building your app on imagine.bo, you can use the Describe-to-Build feature to create internal dashboards that track CLV by cohort, acquisition channel, and pricing tier. You don’t need a data team to see which customers are worth the most.
Common CLV Calculation Mistakes That Skew Your Numbers
Getting CLV wrong is often worse than not calculating it, because bad numbers create false confidence. According to a 2023 Paddle report on SaaS metrics accuracy, 43% of early-stage SaaS founders significantly overestimate CLV by ignoring at least one cost variable (Paddle, 2023).
Ignoring churn in lifespan estimates: Using an aspirational customer lifespan instead of a measured one inflates CLV. If your actual monthly churn is 9% but you’re planning as if customers stay for 3 years, every decision downstream is wrong.
Forgetting support and success costs: Gross CLV ignores the cost of keeping a customer. If your $49/month customer generates an average of $12/month in support costs, your effective margin drops from 70% to 45%.
Not segmenting: Averaging CLV across all customers hides the high-value segments you should be targeting and the low-value segments you should stop acquiring. A single blended CLV number is almost never actionable.
Using revenue instead of profit: If you’re calculating CLV on revenue without subtracting COGS, infrastructure costs, and transaction fees, you’re tracking gross CLV, not net CLV. Net CLV is the number that determines whether you’re building a profitable company.
Getting accurate CLV data also requires clean, structured user data. If your current setup is a spreadsheet and some gut feelings, using AI to automate customer onboarding and data collection can get you to reliable CLV inputs faster than manual tracking.
How to Improve CLV: Practical Levers That Work
Increasing CLV means changing either the revenue per customer, the purchase frequency, or the lifespan. According to Bain & Company, increasing customer retention rates by just 5% increases profits between 25% and 95% depending on the industry (Bain & Company, 2023). Here’s where to focus:
Reduce early churn first. The first 30 to 90 days determine whether a customer becomes long-term or not. Improved onboarding, in-product education, and early check-ins extend lifespan more reliably than any discount program. For SaaS, time-to-first-value is the single strongest predictor of 12-month retention.
Raise prices on your best segments. If your $99 plan has a 3x higher CLV than your $29 plan, the right move is rarely to acquire more $29 customers. Test a price increase on your highest-retention segments. Even a 15% increase compounded over a 24-month lifespan adds significant CLV.
Add expansion revenue paths. Usage-based pricing, add-on features, and tiered plans all increase average purchase value over time. Customers who expand their plan after month 3 have CLVs 2 to 4 times higher than customers who stay on the entry tier.
Analyze and act on customer feedback. Customers who feel heard and who see their feedback addressed churn at lower rates. Building a simple feedback loop into your product is a retention lever that compounds quietly.
If you’re monetizing a prompt-built app and want to move past one-time revenue into recurring CLV, the expansion revenue path is the most direct route from a single-payment model to a sustainable subscription business.
FAQ: Customer Lifetime Value
What is the simplest customer lifetime value formula for a small business?
The simplest version is: CLV = Average Purchase Value x Purchase Frequency x Average Customer Lifespan. For a subscription business with monthly billing, this becomes: Monthly Revenue Per Customer x Average Months Before Churn. According to Shopify’s 2024 analytics documentation, this formula is accurate enough for decisions at the 0 to 1,000 customer stage (Shopify, 2024).
How do I calculate customer lifetime value for a SaaS product?
For SaaS, use: CLV = (Monthly Recurring Revenue Per Customer / Monthly Churn Rate) x Gross Margin %. If your MRR per customer is $49, monthly churn is 5%, and gross margin is 72%, your CLV is ($49 / 0.05) x 0.72 = $705.60. According to Profitwell’s 2023 benchmark data, median CLV for B2B SaaS products priced between $20 and $100/month ranges from $600 to $2,400 depending on vertical (Profitwell, 2023).
What is a good customer lifetime value to customer acquisition cost ratio?
A 3:1 CLV to CAC ratio is the standard benchmark for sustainable SaaS growth. A ratio below 2:1 indicates your acquisition costs are too high or your retention is too weak, and scaling in that state typically accelerates losses. According to First Page Sage’s 2024 SaaS benchmarks, top-quartile SaaS companies maintain CLV:CAC ratios between 4:1 and 6:1 (First Page Sage, 2024).
How often should I recalculate customer lifetime value?
Recalculate CLV monthly if you’re actively changing pricing, onboarding, or acquisition channels. Recalculate after every major product change or pricing test. According to Profitwell’s 2023 SaaS Benchmarks Report, companies that update CLV calculations at least monthly are 1.5x more likely to catch retention problems before they become material to revenue (Profitwell, 2023).
Can I calculate CLV before I have enough data?
Yes, with caveats. Use industry benchmarks for your churn assumption and your own early data for purchase value and frequency. A 5% to 8% monthly churn rate is a reasonable starting assumption for consumer SaaS before you have measured data. According to Paddle’s 2023 SaaS Metrics Report, early CLV estimates based on the first 90 days of retention data are accurate within 20% to 30% of the actual 12-month CLV in most cases (Paddle, 2023).
Conclusion
Three things matter most from this article. First, CLV without segmentation is noise. Calculate it by channel, pricing tier, and user type before drawing any conclusions about your business health. Second, the CLV:CAC ratio is your growth compass. A number below 3:1 means fix retention or acquisition cost before scaling spend. Third, CLV is a lagging indicator of decisions you’re making today, specifically around onboarding, pricing, and product development. The way to improve CLV is to change those upstream decisions, not chase the metric itself.
If you’re building a product on imagine.bo and want to track CLV properly without a data team, the Describe-to-Build feature can get you a working analytics dashboard in hours, not weeks. Start with the basic formula, segment it by cohort, and let the data tell you where to focus.
For a broader framework on testing and validating the product decisions that drive CLV, the product-market fit framework for no-code products is worth reading alongside this one.
Launch Your App Today
Ready to launch? Skip the tech stress. Describe, Build, Launch in three simple steps.
Build