Most founders collect plenty of data. Revenue figures, signup rates, churn percentages, support ticket volume. Most of it sits in spreadsheets that nobody opens until something goes wrong. The issue isn’t missing data. It’s that raw numbers don’t communicate on their own; stories do. According to McKinsey Global Institute, data-driven organizations are 23 times more likely to acquire customers than competitors who rely on intuition alone (McKinsey Global Institute, 2013). This article shows you how AI-powered no-code dashboards close the gap between data you have and decisions you can act on, which tools are worth your time, and how to build a working dashboard app from a plain English prompt with no development background.
If you’ve been manually assembling weekly reports, the guide on automating reports and dashboards with no-code tools is a strong companion to this article.
TL;DR: AI-powered no-code dashboards let non-technical founders visualize and communicate business data without writing code or hiring a developer. Gartner projected that 70% of new enterprise applications would use low-code or no-code technology by 2025 (Gartner, 2021). The best dashboards don’t just surface metrics. They frame context, flag what changed, and tell a viewer exactly what to act on next.
What Is Data Storytelling, and Why Should Non-Technical Founders Care?
Data storytelling is the practice of combining metrics, visualizations, and narrative context to explain what numbers actually mean. It’s not a design exercise. It’s a communication strategy for people who have to make decisions fast. According to Tableau’s 2023 Analytics Trends Report, 79% of analytics professionals identify data storytelling as the highest-impact skill for driving business decisions, yet fewer than one in three organizations have a formal approach to it (Tableau/Salesforce, 2023).
For a solo operator or small founding team, this gap costs money in the form of decision lag. You may know your MRR dropped 8% this month. But does your co-founder understand why? Does your first investor see the same pattern you see? A well-built dashboard answers those questions before anyone has to schedule a meeting to discuss them.
The actual cost of poor data communication isn’t ugly charts. It’s the meeting that gets scheduled to interpret a number that should have been self-explanatory. Every time your team has to gather to decode a metric, you’re spending collective executive time on something a well-labeled chart could have resolved in thirty seconds. Good dashboards eliminate that meeting entirely.
For a deeper look at how visual data tools work at the platform level, the guide on AI-powered no-code data visualization covers the technical side without requiring a technical background.
Citation capsule: Tableau’s 2023 Analytics Trends Report found that 79% of analytics professionals rate data storytelling as the single highest-impact skill for business decision-making, yet fewer than a third of organizations have a defined process for producing it (Tableau/Salesforce, 2023).
How Do AI-Powered No-Code Dashboards Work in Practice?
The defining difference between a traditional dashboard tool and an AI-powered no-code platform is where the work happens. Traditional tools require you to write SQL, map data fields manually, and configure chart types through nested settings menus. AI-powered no-code dashboard builders interpret your intent from plain English input and handle the underlying logic automatically. According to Gartner, 70% of new enterprise applications would incorporate low-code or no-code technologies by 2025, up from fewer than 25% in 2020, driven by the accelerating demand for faster software delivery (Gartner, 2021).
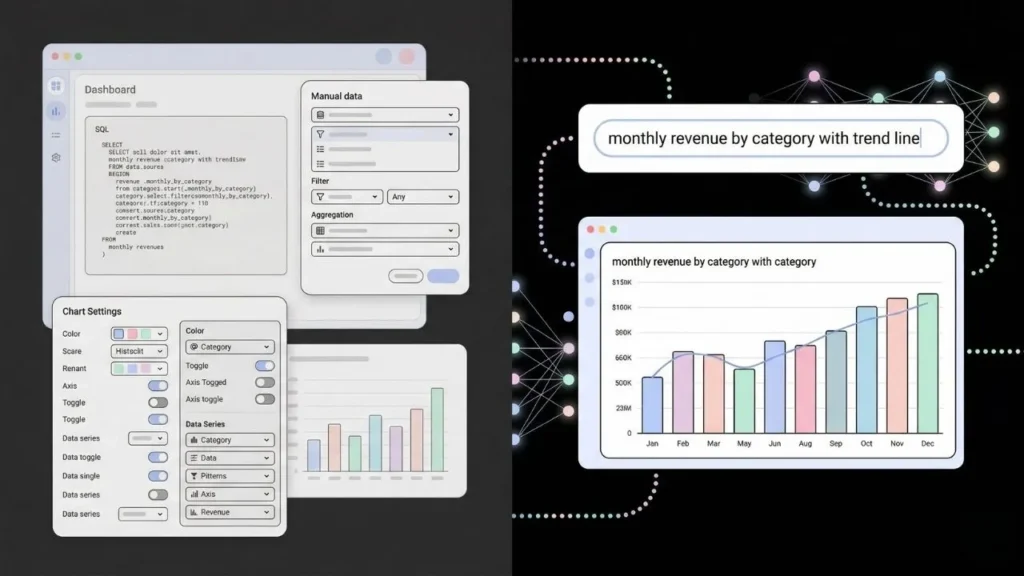
When you describe a visualization in plain English, the platform maps your description to the underlying data schema, selects an appropriate chart type, writes the query, and renders the result. You don’t choose between a bar chart and a line chart by clicking a dropdown. You say “show me monthly revenue by product category with a trend overlay” and the platform makes the decision based on your data structure and stated intent.
When building a revenue tracking view using imagine.bo’s Describe-to-Build feature, prompting “show a bar chart of monthly signups alongside churn rate as a line overlay” produces a working, connected visualization within a single iteration. There’s no column mapping screen, no field configuration panel, and no separate step to connect the data source. The AI reads your app’s own schema and builds the view against live data.
For broader context on how AI handles data queries without code, the post on no-code AI tools for data analysis and visualization covers the technology in more depth.
Citation capsule: Gartner projected that by 2025, 70% of new enterprise applications would be built using low-code or no-code platforms, compared to under 25% in 2020, citing demand for faster development cycles and reduced dependency on specialist engineering skills (Gartner, 2021).
Which No-Code Dashboard Tools Are Worth Using in 2025?
Not every no-code dashboard tool fits the same use case. Google Looker Studio is free and works well for teams already inside the Google workspace, but its customization ceiling is low and its AI capabilities are minimal. Retool gives you more flexibility but requires JavaScript knowledge for anything non-trivial. Metabase sits in between: open-source, reasonably customizable, and easier to self-host than most alternatives. According to Forrester, the low-code development platform market reached approximately $13.8 billion in 2023 and is projected to grow at a 22% compound annual growth rate through 2028 (Forrester, 2023), with embedded analytics listed as the fastest-growing sub-category.
For founders who want a dashboard built directly into their product rather than a standalone reporting tool bolted on the side, imagine.bo’s Describe-to-Build creates custom reporting views as native screens inside your full-stack application. Your users never leave your product to view their data. That changes retention in ways that a linked-out BI tool cannot replicate.
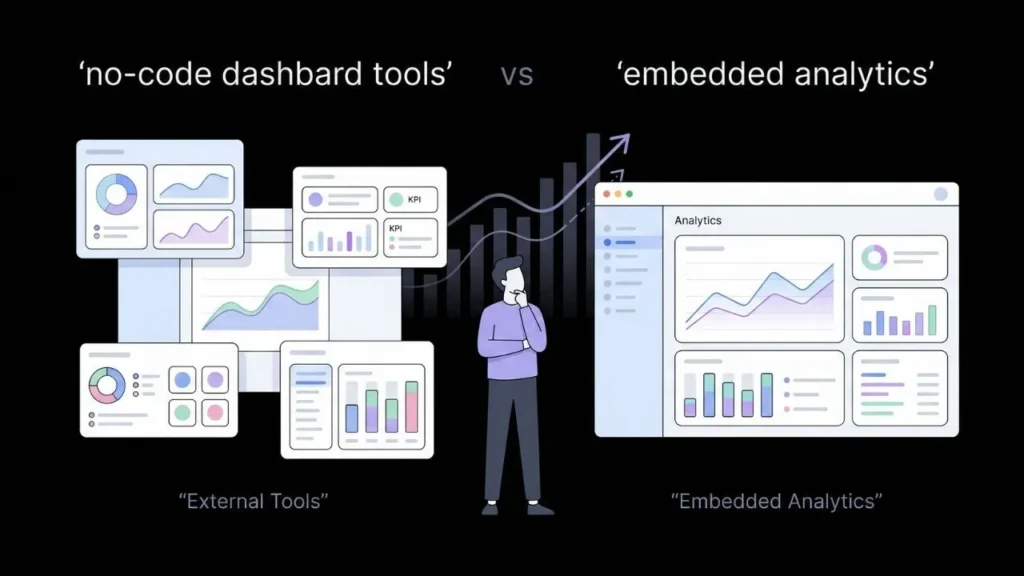
The meaningful comparison isn’t between individual chart libraries. It’s between embedded analytics as a product feature and external BI tools as a workaround. If your users need to open a separate platform to understand their own data, that’s a product gap, not a reporting gap.
For founders thinking about where predictive data features fit in an MVP, the guide on no-code AI predictive analytics covers the next layer of capability beyond standard dashboards.
Citation capsule: Forrester’s low-code platform market analysis estimated the sector at approximately $13.8 billion in 2023 with a 22% compound annual growth rate projected through 2028, driven primarily by demand for embedded analytics and internal tooling from non-technical business teams (Forrester, 2023).
How Do You Design a Dashboard That Drives Decisions Instead of Just Displaying Data?
A dashboard that shows everything communicates nothing. The most common mistake non-technical founders make when building their first dashboard is including every metric they can think of. The result is a wall of numbers that no one acts on. A 2022 Bain and Company analytics benchmarking study found that analytics leaders, defined as organizations whose teams consistently act on data insights, were twice as likely to be in the top quartile for decision speed and three times more likely to execute decisions as intended (Bain and Company, 2022).
The right design approach starts with the decision, not the data. Ask one question before placing a single chart: what is the one thing this dashboard needs to answer every time someone opens it? For a SaaS founder, that might be “are we growing faster than we’re churning?” For a marketplace operator, it might be “which acquisition channel produces the highest lifetime value customers?” Every chart on the dashboard should serve that central question or provide context for it.
A practical framework that works well in practice: limit any single dashboard view to three primary metrics and no more than six supporting metrics. Primary metrics belong in the top row, large and unambiguous. Supporting metrics go below in a smaller format. Annotations, short text notes explaining why a number spiked or dropped on a specific date, add more decision value than any additional chart you could place on the screen. Most founders who build dashboards add more charts when they should be adding more annotations.
For founders transitioning from spreadsheet-based reporting to a purpose-built internal tool with dashboards included, the post on automating internal tools from spreadsheets into SaaS walks through that transition in concrete terms.
Citation capsule: Bain and Company’s 2022 analytics benchmarking study identified analytics leaders as twice as likely to rank in the top quartile for decision speed and three times more likely to execute on decisions as intended, compared to organizations that collected data without a structured interpretation process (Bain and Company, 2022).
How Does imagine.bo Build a Custom Dashboard App From a Plain English Prompt?
imagine.bo is purpose-built for the founder who knows what they want to see but has no interest in writing SQL or hiring a frontend developer to build a reporting view. Using the Describe-to-Build feature, you type a plain English description of the dashboard you need. Something like “build an internal ops dashboard showing daily order volume, fulfillment rate, and the top five products by revenue this week” is enough to generate a full application including the database schema, backend data connections, and frontend UI. According to Makerpad’s State of No-Code 2024 survey, 67% of no-code builders ranked time-to-first-working-prototype as the most important criterion for platform selection, ahead of pricing, integrations, and customization depth (Makerpad, 2024).
The AI-Generated Blueprint step shows you the planned application structure before anything is built, so you can review and adjust the spec before committing. Once confirmed, the app deploys automatically to Vercel for the frontend and Railway for the backend, with role-based access control built in so only the right team members see the right data views.
When the AI reaches its limits on a specific visualization or integration, the Hire a Human feature lets you assign that task to a vetted engineer directly from the imagine.bo dashboard. No job posting, no freelancer platform, no separate contract. The same workflow, extended by a human when needed.
For teams focused on lean operation and building efficient internal tools across the whole business, not just reporting, the post on AI automation for small teams covers the broader context.
Citation capsule: Makerpad’s State of No-Code 2024 survey found that 67% of no-code platform builders ranked time-to-first-working-prototype as the top selection criterion, prioritizing speed over price, third-party integrations, and customization options (Makerpad, 2024).
Frequently Asked Questions
What is data storytelling in the context of no-code dashboards?
Data storytelling is the practice of combining metrics, visualizations, and written context to explain what a number means and what action it implies. In a no-code dashboard, this translates to adding annotations, trend comparisons, and narrative labels rather than just charting raw values. According to Tableau, 79% of analytics professionals rate data storytelling as the highest-impact skill for driving business decisions (Tableau/Salesforce, 2023).
Do I need technical knowledge to build an AI-powered dashboard?
No. Platforms like imagine.bo generate dashboards from plain English descriptions. You describe the metrics and layout you want, and the AI writes the queries, builds the UI, and connects the data source. Gartner’s 2021 projection that 70% of new enterprise applications would use low-code or no-code technology by 2025 was grounded specifically in the expectation that technical barriers to software creation would come down for non-developers (Gartner, 2021).
What is the difference between a BI tool and a no-code dashboard builder?
Traditional BI tools like Tableau or Power BI are built for data analysts who know SQL and data modeling. No-code dashboard builders are designed for business operators who know the question they want answered but not how to write the query. Forrester’s projection of 22% annual growth in the low-code market through 2028 reflects surging demand from that second category of user (Forrester, 2023). For a broader look at the tool landscape, the post on no-code AI tools for data analysis is a useful reference.
Can I embed a custom dashboard inside my web application?
Yes. With imagine.bo’s Describe-to-Build, you build the dashboard as a screen inside your full-stack web app rather than as a standalone external tool. Your end users see a reporting view inside the product they already use, without needing login credentials to a separate BI platform. Makerpad’s 2024 survey listed embedded analytics as one of the fastest-growing use cases across no-code platforms (Makerpad, 2024).
How do AI-powered dashboards differ from standard chart builders?
Standard chart builders require you to manually select chart types, map data fields, and configure filters through settings panels. AI-powered dashboards interpret your intent from plain English input, select appropriate visualizations automatically, and can surface patterns in the data that you didn’t specifically request. Bain and Company found that analytics leaders who acted on data insights were twice as likely to rank in the top quartile for decision speed (Bain and Company, 2022).
Conclusion
Three things matter most from everything covered here. First, data storytelling is not a nice-to-have for founders who want their team and investors to stay aligned on what’s actually happening in the business. Second, AI-powered no-code dashboards have removed the technical barrier that used to make custom reporting an expensive, developer-dependent project. Third, the best dashboards are built around one specific decision, not around displaying the maximum amount of available data.
If you’re ready to build a dashboard that communicates your business clearly, start with imagine.bo’s Describe-to-Build and type the one question you most need your data to answer. The platform generates the full application including the database schema, backend logic, frontend UI, and automatic deployment in one workflow. For teams ready to go further and build a complete data-driven product, the guide on how to build a SaaS with AI and no-code covers the full product build process from prompt to launch.
Start your first dashboard at imagine.bo today. The free plan requires no credit card.