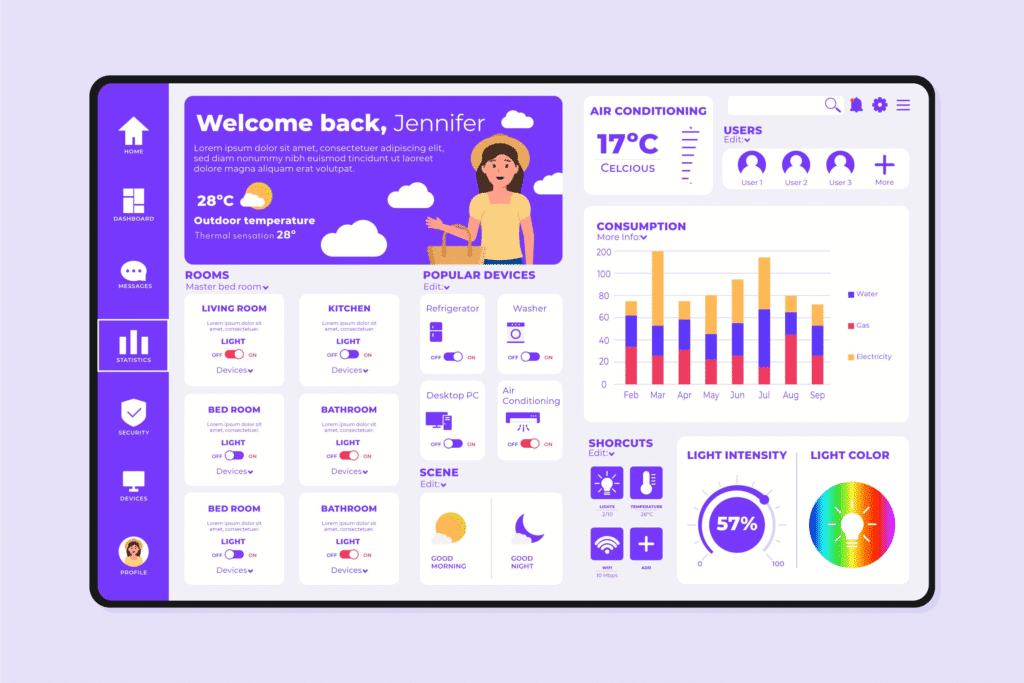
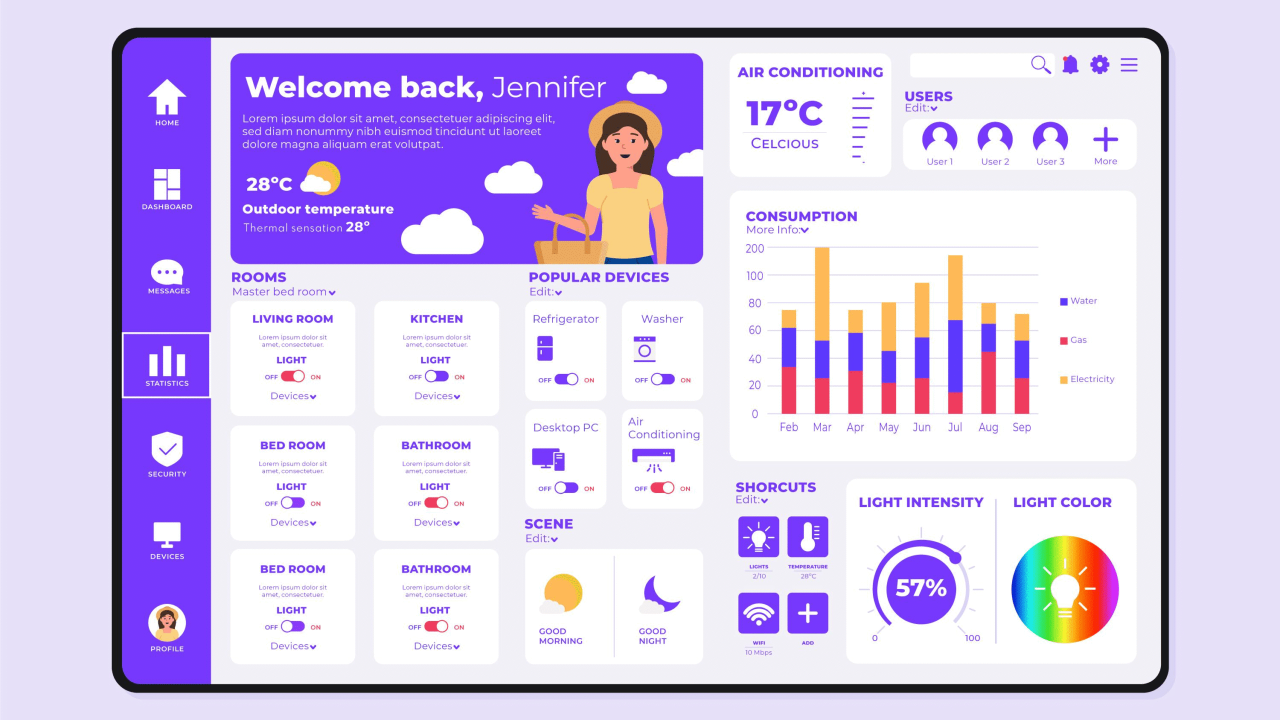
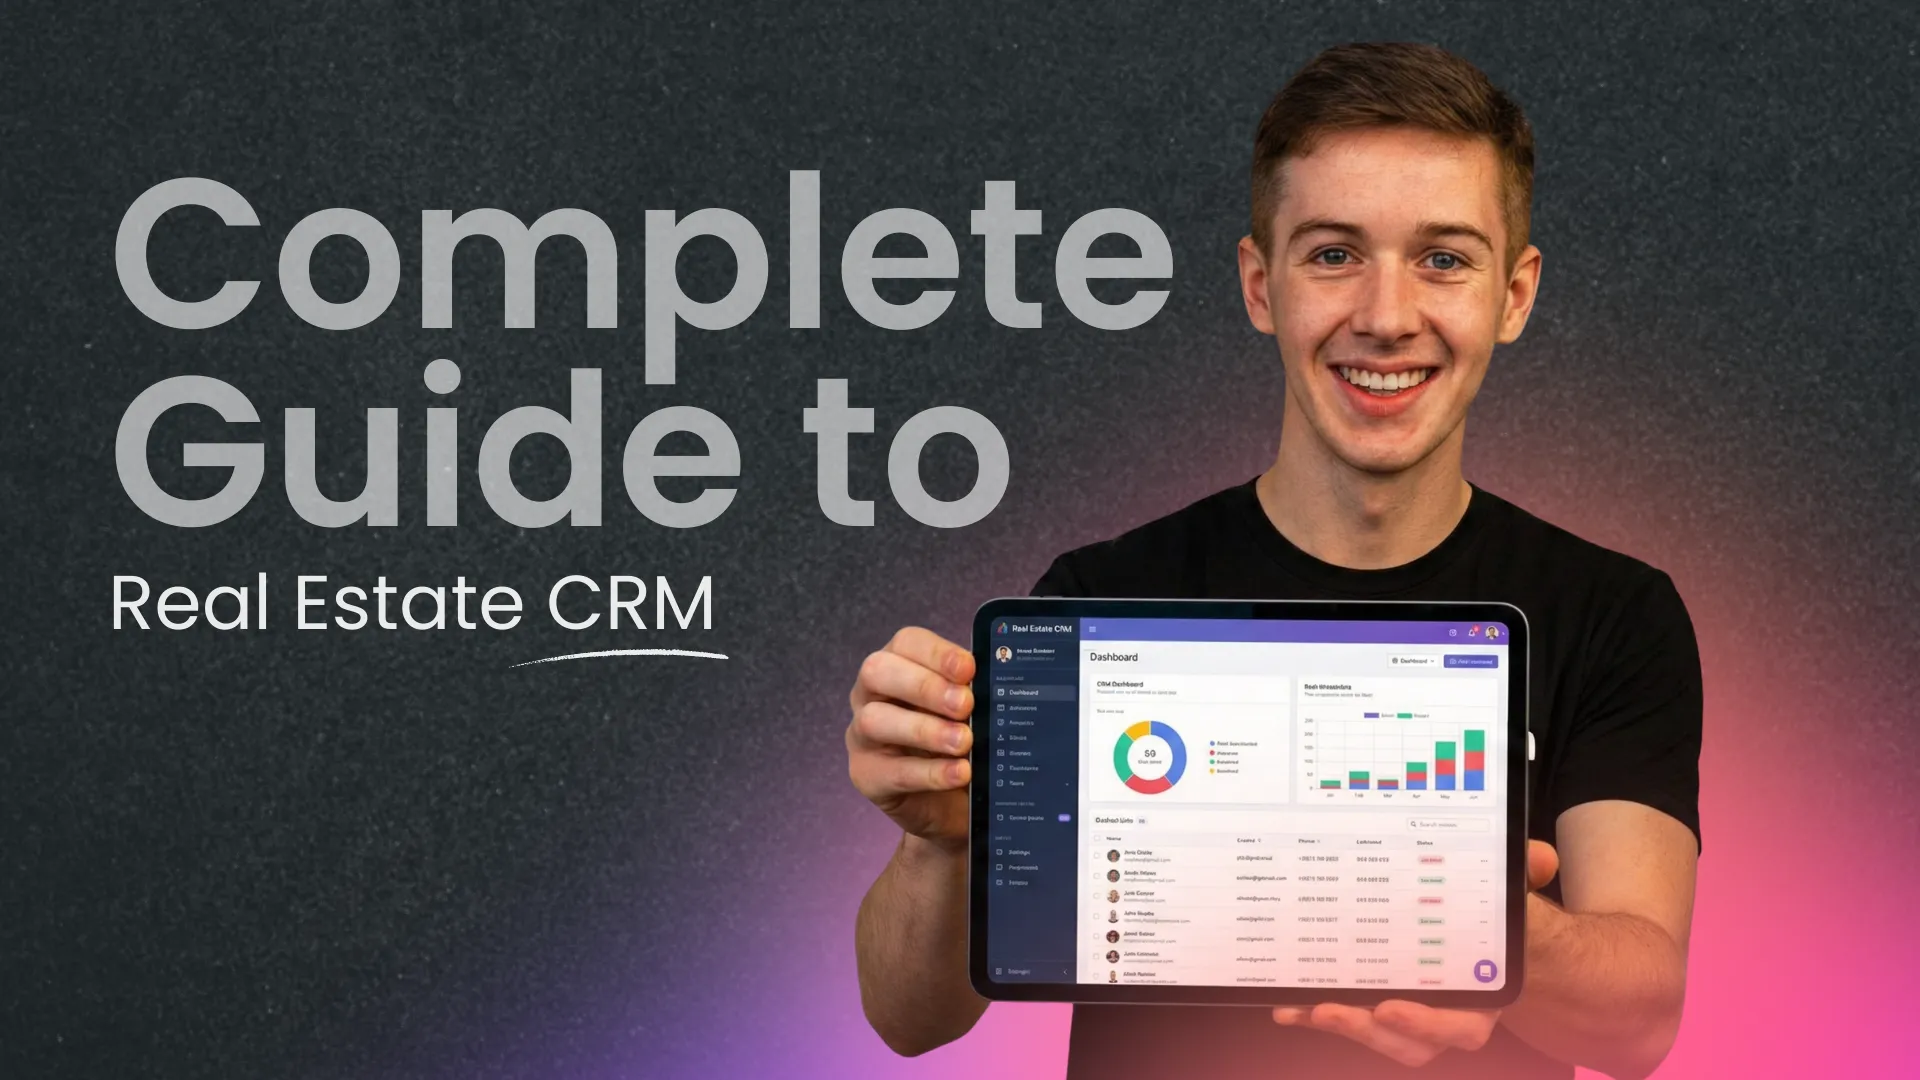
Creating custom dashboards using prompt-based tools allows users to build tailored visualizations quickly and with minimal technical skills. These tools leverage AI to transform simple text prompts into interactive, data-driven dashboards that can connect multiple data sources and update automatically. This approach streamlines the dashboard creation process, enabling faster insights and more personalized data views.
By using prompts, users can specify fields, chart types, and data filters simply through natural language commands. This eliminates the need for complex coding or manual design, making dashboard generation accessible to a wider range of professionals. It also supports enhanced customization, allowing dashboards to match specific business needs or personal preferences.
Launch Your App Today
Ready to launch? Skip the tech stress. Describe, Build, Launch in three simple steps.
BuildAs AI-powered platforms continue to evolve, they offer features like real-time updates, easy integration with existing systems, and export options for popular tools like Tableau or Power BI. These advancements make prompt-based dashboard creation an effective tool for improving data visualization and decision-making workflows.
Understanding Prompt-Based Tools

Prompt-based tools use natural language inputs to generate specific outputs, reducing the complexity of creating systems like dashboards. These tools rely on AI to interpret user instructions and transform data into meaningful visualizations or actions. Their design emphasizes ease of use, adaptability, and rapid deployment.
What Are Prompt-Based Tools?
Prompt-based tools allow users to control software behavior by typing or speaking instructions in everyday language. Instead of programming, users provide prompts that specify what data to analyze or how to display it.
These tools interpret input through AI models that understand context, intent, and data relationships. For dashboards, this means creating visual interfaces by describing desired metrics, layouts, or filters without manual coding.
Imagine.bo is an example platform leveraging prompt-based technology to streamline dashboard creation. Users can input straightforward commands and receive interactive, customized visualizations tailored to their datasets.
How AI Powers Custom Dashboards
AI models process prompts by converting ambiguous or broad instructions into specific dashboard configurations. They parse key elements like data sources, chart types, and interactive features.
This automation enables real-time dashboard generation, offering options for dynamic filtering, drill-downs, and responsive layouts. AI also assists in identifying relevant data patterns to enhance insights.
Platforms like Imagine.bo integrate large language models with data connectors, merging natural language understanding and data processing. This reduces manual effort and speeds up development cycles, letting users iterate quickly based on evolving needs.
Benefits of Using Prompt-Based Solutions
Prompt-based solutions lower technical barriers, enabling non-technical users to create, modify, and enhance dashboards without deep coding expertise.
They improve efficiency by shortening development time and allowing fast adjustments to reports. This flexibility fosters better decision-making with updated data representations.
Furthermore, these tools support scalability by adapting to growing datasets and evolving analytical requirements. Imagine.bo exemplifies this by providing a platform that balances simplicity with customization, making dashboard creation accessible yet powerful.
Getting Started with Imagine.bo for Dashboard Creation
Imagine.bo streamlines the process of turning dashboard concepts into functional designs without coding. It focuses on clear input from users and delivers practical, AI-driven blueprints that guide development.
Joining the Imagine.bo Private Beta
To access Imagine.bo, users must join its private beta program. This involves signing up on the official site and submitting basic information about their experience and intended use. Early access gives users a chance to explore features before the general public.
Beta participants receive onboarding materials highlighting core functionalities. The program is designed primarily for non-technical founders, entrepreneurs, and agencies who want to create custom dashboards without writing code. Invitations may be limited, so prompt registration is recommended to secure a spot.
Describing Your Dashboard Idea
Once enrolled, users input a detailed description of their dashboard goals into Imagine.bo’s interface. The system encourages specific details such as data sources, key metrics, and desired visualizations. This step is critical as it governs the accuracy of the AI’s output.
Users should focus on what insights the dashboard should provide and how they want to interact with data. For example, describing trends to track or reports to generate helps refine the AI’s understanding. Clear and structured input improves the relevance of generated suggestions.
AI-Generated Dashboard Blueprint
After submitting the idea, Imagine.bo generates an AI-driven blueprint. This document outlines the recommended dashboard layout, widget types, and data integration steps. It acts as a preliminary design template to facilitate development.
The blueprint includes visual elements such as charts and graphs aligned with the described metrics. It simplifies the transition from concept to functioning dashboard by providing a tangible plan. Users can review and modify this blueprint before proceeding to build or hand off to developers.
Building Custom Dashboards Without Code
Creating custom dashboards has become accessible without programming knowledge. This approach focuses on efficient dashboard construction, integrating analytics seamlessly, and managing multiple client projects with professional-grade quality.
One-Click Build Process
The one-click build process allows users to generate dashboards instantly by connecting data sources and applying predefined templates. This eliminates manual setup and coding, reducing development time significantly.
Users simply upload data or link APIs, choose visualization types, and the system creates interactive dashboards automatically. This process supports zero-code needed environments, making it suitable for non-technical users.
Additionally, the one-click method often includes customization options for colors, filters, and layouts, permitting quick tailoring without complexity. It balances simplicity with enough flexibility to meet specific business needs.
Production-Ready Analytics Integration
Dashboards built with no code tools can integrate advanced analytics components to provide real-time data insights. These include charts, KPIs, and trend analyses that update dynamically.
Professional-grade quality ensures the dashboards are reliable enough for business decision-making. Backend connections to databases such as PostgreSQL or REST APIs enable live data feeds without manual intervention.
Many platforms support embedding machine learning outputs or predictive analytics as well. This integration empowers users to monitor performance continuously and forecast outcomes within the same dashboard environment.
Handling Multiple Client Projects
Managing several dashboards for different clients requires streamlined project organization and scalability. No-code builders often feature templates and cloning capabilities to replicate dashboards quickly across projects.
They also provide multi-client management interfaces, which help keep data separate and access control strict. This ensures client-specific customization while maintaining security standards.
Expert backup support is typically available for resolving technical issues and optimizing dashboard designs across projects. This professional assistance helps maintain quality and consistency when scaling to multiple clients.
Key Features and Scalability
Creating custom dashboards requires attention to essential aspects like secure data handling, deployment flexibility across cloud platforms, and infrastructure capable of supporting growing user demands. Each of these elements ensures that dashboards remain reliable, compliant, and performant as usage scales.
Security and Compliance Standards
Security is critical when building dashboards that process sensitive or regulated data. Compliance with standards such as GDPR and SOC 2 must be prioritized. This includes data encryption both at rest and in transit, user authentication mechanisms, and access controls to limit data exposure.
Audit trails and logging are also important for maintaining accountability. Dashboards handling personal or business-critical information should integrate role-based access control (RBAC) and regular security assessments. Ensuring compliance reduces legal risks and builds user trust.
Deploying on AWS, GCP, and Vercel
Flexibility in deployment platforms allows dashboards to fit diverse infrastructure needs. AWS and GCP offer robust cloud services for backend infrastructure, storage, and scalable compute power. They support auto-scaling, load balancing, and managed databases which help manage workload spikes efficiently.
Vercel specializes in frontend hosting with fast global CDN delivery, ideal for user-facing components of dashboards that require low latency. Deploying on Vercel works well in combination with AWS or GCP for backend services, enabling a distributed architecture.
Each platform supports continuous integration and deployment workflows, making it easier to update dashboards frequently without downtime.
Infrastructure for High-Traffic Apps
Dashboards designed for high traffic must employ a scalable infrastructure to handle increased data volume and user concurrency. This typically involves load balancing, horizontal scaling, and caching layers to reduce database strain.
Using containerized services or serverless functions can provide dynamic resource allocation based on demand. Also, integrating monitoring tools helps detect performance bottlenecks early.
Adopting a microservices architecture improves fault isolation, allowing parts of the dashboard to scale separately. This approach minimizes downtime and maintains responsiveness even as user numbers grow.
Expert Support and Pricing Transparency
Effective dashboard tools provide reliable expert support and clearly defined pricing plans. Understanding these aspects helps users optimize their workflows and budget with confidence.
Access to Senior Engineers
Expert support often involves direct access to senior engineers for troubleshooting and advanced customization. This level of support ensures that complex issues are resolved efficiently without relying on general customer service representatives.
Users benefit from scheduled consultations, priority ticket handling, and personalized guidance. These services can accelerate implementation and minimize downtime, especially in highly technical environments.
Some platforms include this access only in higher-tier plans, emphasizing the value of dedicated expert assistance in improving dashboard performance and integration.
Beta vs. Paid Plans Pricing Overview
Pricing transparency clarifies what features and support users receive at each subscription level. Beta plans typically offer limited capabilities or trial access with partial support.
Paid plans often unlock full customization options, expert support, and advanced integrations. They may include tiered pricing based on features, user seats, and data volume.
| Plan Type | Features Included | Support Level | Typical Cost Structure |
|---|---|---|---|
| Beta | Basic functionalities, trial period | Limited or community support | Usually free or low-cost |
| Paid | Full features, advanced options | Priority and expert support | Monthly or annual fees |
Transparent pricing helps users assess long-term value and avoid unexpected expenses while ensuring access to necessary expert resources.
Use Cases and Best Practices
Custom dashboards built with prompt-based tools serve distinct needs across various scenarios. They empower teams to develop early-stage products, organize multiple projects efficiently, enhance delivery speed and quality, and address common technical challenges.
Building MVPs for Startups and Agencies
Founders and small agencies leverage prompt-driven dashboards to quickly assemble Minimum Viable Products (MVPs). These dashboards focus on core metrics like user activity, sales trends, and engagement patterns. By using templates and customizable prompts, teams reduce development time and cost.
The iterative nature of prompt tools allows fast feedback loops. Teams can adjust data visualizations or add new KPIs without extensive coding. This agility supports rapid validation and pivots during early product phases, a critical advantage for startups prioritizing speed to market.
Security remains vital; role-based access ensures sensitive data stays restricted to authorized users. This governance is crucial for agencies handling multiple clients, maintaining trust and compliance.
Managing Multiple Dashboard Projects
Small agencies and solo makers often juggle several dashboard projects simultaneously. Prompt-based tools streamline this by enabling centralized management through standardized prompts and reusable components. Consistency in dashboard structure improves maintenance and client satisfaction.
They can set up modular dashboards where common elements like charts or filters are shared across projects. This reduces duplication and accelerates updates when business needs change. Tools that support interactive visualizations, including heat maps or trend lines, help highlight performance variances clearly for each client.
Effective communication of data insights is possible through clear layouts tailored for diverse stakeholder groups. Establishing best practices such as avoiding clutter and grouping related information ensures dashboards remain user-friendly across projects.
Maximizing Speed and Quality
Speed and quality are balanced by applying prompt best practices and UI/UX principles. Clear, structured prompts enable natural language processing models to generate accurate and insightful data visualizations quickly. Teams avoid common pitfalls like excessive detail or poor chart selection by focusing on clarity and relevance.
Incorporating interactive elements directly through prompts helps stakeholders engage with data in real time. This reduces the back-and-forth between data teams and consumers, shortening delivery cycles.
Dashboards should minimize visual noise and leverage color strategically for immediate comprehension. The combination of automated prompt generation and thoughtful design contributes to outputs that are both fast and of high quality, supporting efficient decision-making.
Overcoming Technical Barriers
Technical obstacles such as data integration, role-based access control, and visualization complexity can slow dashboard creation. Prompt-based tools address these challenges by abstracting complexity through user-friendly language prompts.
They often support seamless connections to multiple data sources, reducing manual extraction or transformation work. Role-based access mechanisms help govern who sees what, securing sensitive or governance-related data.
Models behind prompt-based dashboards are designed to interpret and optimize commands, converting them into appropriate visual elements while handling format or compatibility issues automatically. This lowers the barrier for non-technical users, enabling founders and small agencies to build powerful dashboards without deep coding skills.
Conclusion
Prompt-based tools enable users to create custom dashboards efficiently without deep coding knowledge. They translate natural language requests into visual data representations, reducing development time.
These tools often leverage large language models and automation to generate charts and insights. This approach supports rapid prototyping and iteration, making dashboards adaptable to changing business needs.
Users gain flexibility by specifying dashboard features through clear prompts. This method simplifies complex tasks like querying databases or generating narrative visuals.
Key benefits include:
- Faster dashboard creation
- Lower technical barriers
- Enhanced ability to customize dynamically
- Integration with existing data sources
While prompt-driven dashboards increase accessibility, the quality of output still depends on precise and well-structured prompts. Users should combine domain knowledge with prompt design to achieve meaningful results.
In practice, prompt-based dashboard creation complements traditional development. It serves as a powerful tool for exploration and initial builds that can be refined into full solutions.
Embracing these tools helps organizations harness AI capabilities for more insightful and timely data presentations. They represent a practical step toward democratizing data analysis and visualization.
Launch Your App Today
Ready to launch? Skip the tech stress. Describe, Build, Launch in three simple steps.
Build


