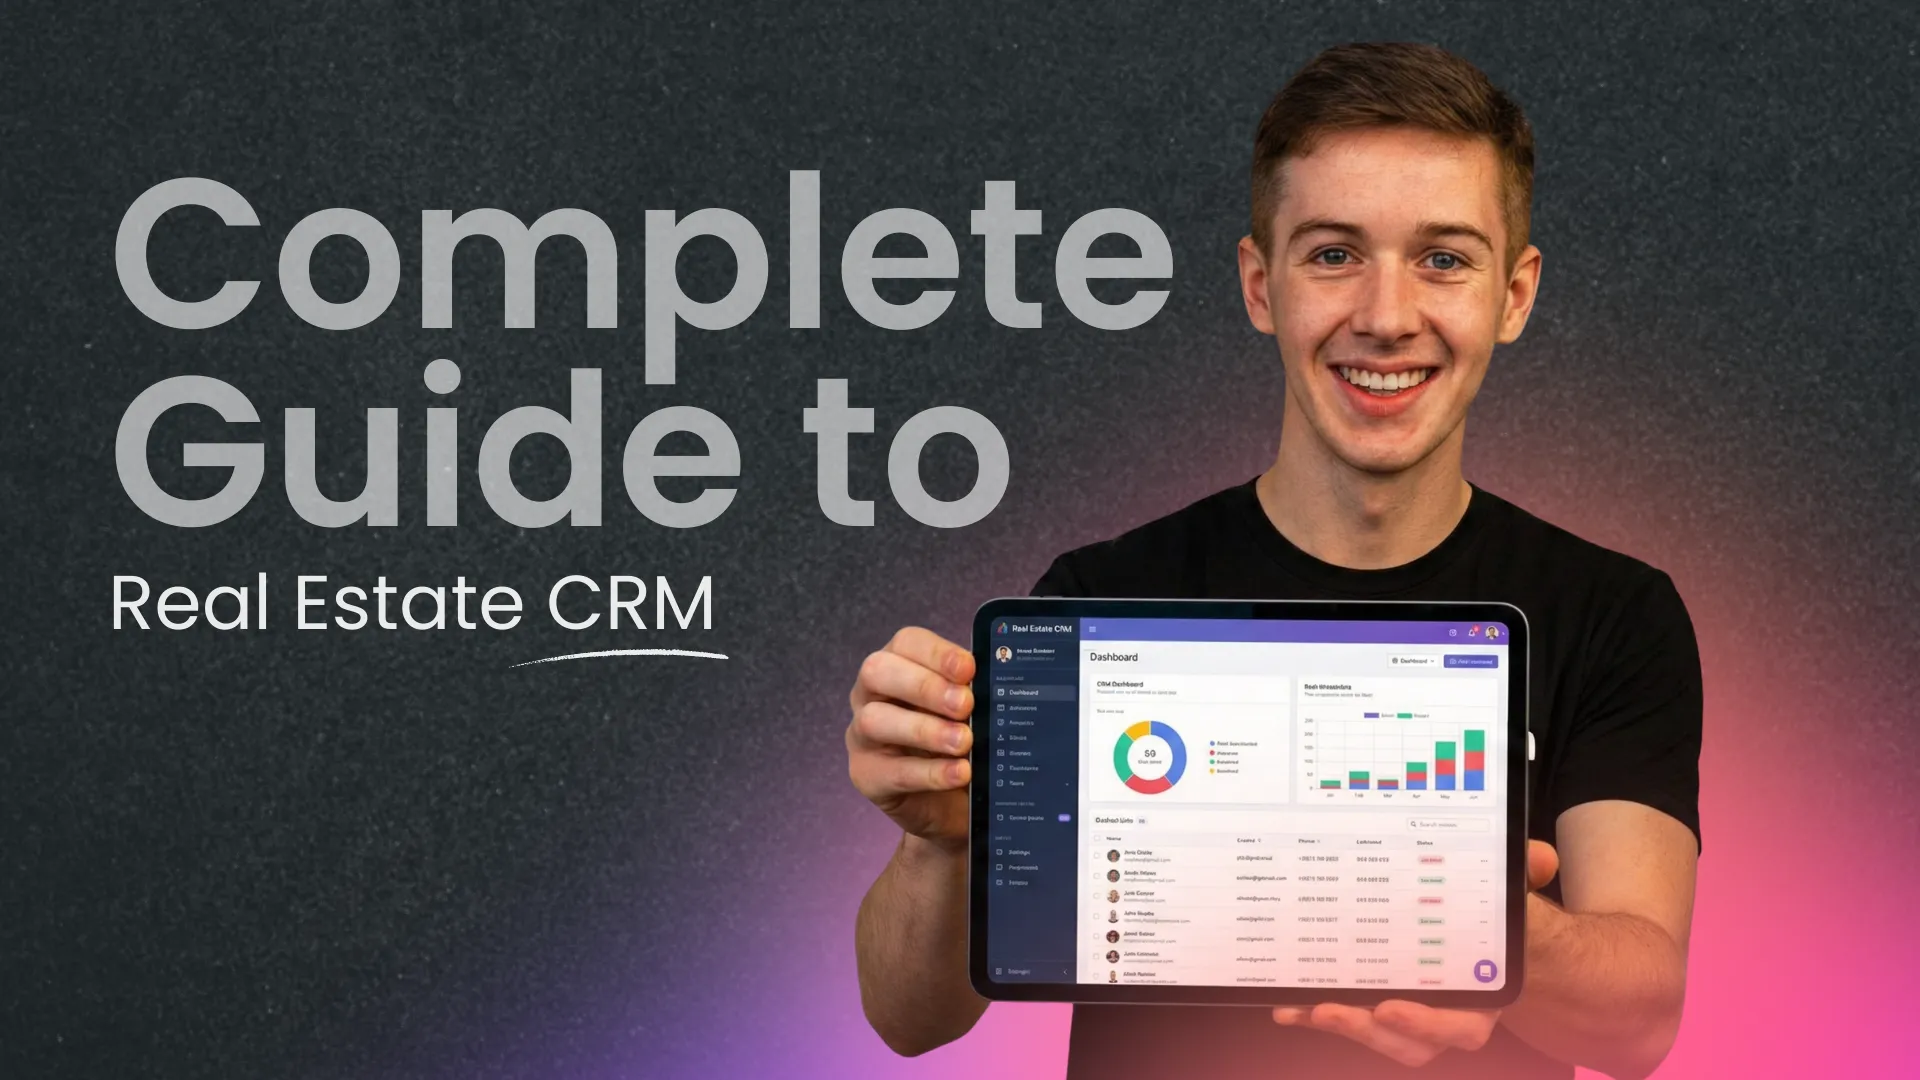
In a data-driven organization, custom dashboards are vital for ensuring stakeholders have access to the insights they need—quickly, clearly, and consistently. Whether you’re presenting sales performance to executives, product metrics to developers, or campaign ROI to marketers, a well-crafted dashboard bridges the gap between raw data and informed decision-making.
This guide walks you through why stakeholder dashboards matter, what they should include, and how to build them with clarity, alignment, and purpose.
Launch Your App Today
Ready to launch? Skip the tech stress. Describe, Build, Launch in three simple steps.
BuildWhy Custom Dashboards Matter
Generic reports often overwhelm or under-deliver. Stakeholders have different goals, questions, and levels of technical understanding. A tailored dashboard ensures:
- Relevance: Only displays data that matters to that stakeholder.
- Clarity: Simplifies complex data into actionable visuals.
- Efficiency: Reduces time spent parsing spreadsheets or interpreting raw logs.
- Transparency: Aligns everyone with shared goals and real-time visibility.
Step 1: Identify Stakeholders and Their Needs
Start by defining who the dashboard is for and what they need from it.
| Stakeholder | Key Interests | Typical Metrics |
| Executives | Business performance, KPIs | Revenue, growth rate, customer churn |
| Product Managers | Feature usage, bugs, feedback loops | MAU, feature adoption, NPS |
| Marketing Teams | Campaign performance, ROI | CTR, CAC, conversion rate |
| Sales Managers | Pipeline visibility, deal health | MRR, closed-won rate, quota progress |
| Customer Success | Retention, engagement, support tickets | Churn rate, support response time, CSAT |
Ask Questions Like:
- What is the primary decision this dashboard should help with?
- How often will the stakeholder use it?
- What level of detail is appropriate?
Step 2: Choose the Right Metrics and KPIs
Avoid the “data dump” approach. Instead, prioritize key performance indicators (KPIs) that align with the stakeholder’s goals.
✅ Best Practices:
- Include only 5–10 primary metrics.
- Use clear, non-technical language for metric labels.
- Group metrics by objective (e.g., acquisition, retention, performance).
Example for a Marketing Dashboard:
| Metric | Description |
| Website Visitors | Total sessions over time |
| Bounce Rate | % of users who leave immediately |
| Campaign CTR | Click-through rate of paid ads |
| Leads Generated | Total form submissions |
| Cost Per Lead | Average spend per lead acquired |
Step 3: Select a Dashboarding Tool
Choose a platform that integrates with your data sources and offers the right mix of visuals and usability.
| Tool | Best For | Key Features |
| Looker | Enterprise analytics | Powerful modeling, role-based views |
| Power BI | Microsoft ecosystem users | Custom visuals, strong integration |
| Tableau | Interactive data storytelling | Advanced visualizations, drill-downs |
| Google Data Studio | Free & flexible reports | Simple sharing, integrates with GA |
| Metabase | Product and engineering teams | Open-source, fast dashboards |
| Klipfolio | Marketing and sales teams | Real-time metrics, mobile-ready |
Step 4: Design for Readability and Flow
Design matters as much as data. Stakeholders often glance at dashboards between meetings, so clarity is key.
🧩 Dashboard Design Tips:
- Use charts over tables: Bar, line, pie, or funnel charts enhance comprehension.
- Apply consistent color-coding (e.g., green for success, red for issues).
- Arrange in top-to-bottom priority: Most critical KPIs go at the top.
- Include tooltips or definitions for less familiar metrics.
- Make it mobile- and PDF-friendly for quick access.
Step 5: Automate Updates and Alerts
Dashboards must be up-to-date to be useful. Automate updates and build alert systems for critical thresholds.
Automation Features to Consider:
- Live refresh: Connect to real-time data sources.
- Scheduled snapshots: Email weekly or monthly reports to stakeholders.
- Threshold alerts: Notify when a KPI exceeds/falls below a set point.
- Annotations: Add context for spikes or dips (e.g., “Black Friday promo”).
Step 6: Test with Stakeholders and Iterate
Before launching widely, test the dashboard with its intended audience.
Ask for feedback:
- Is any metric confusing or missing?
- Is the layout intuitive?
- Do visuals clearly support decision-making?
Iterate often—business needs evolve, and dashboards should too.
Step 7: Train and Empower Stakeholders
Even the best dashboards are useless if no one uses them. Offer a short walkthrough or documentation to help users:
- Interpret metrics correctly
- Drill down into details (if available)
- Export data if needed
- Understand update frequency
Consider hosting a quick demo or including a 2-minute screen recording.
Real-World Use Case: Product Team Dashboard
Audience: Product Managers
Goal: Monitor feature performance and user engagement
| Metric | Visualization | Notes |
| Daily Active Users | Line chart | Tracks overall product usage |
| Feature Usage Rate | Bar chart | Compares adoption of recent features |
| NPS Score | Scorecard + trend | Aggregates user satisfaction feedback |
| Bug Reports | Table + severity pie | Categorized by priority |
| Session Duration | Trend line | Tracks user engagement |
Common Dashboard Mistakes to Avoid
| Mistake | Why It Hurts |
| Information overload | Causes confusion and undermines key messages |
| Technical jargon | Makes dashboards inaccessible to non-technical users |
| Static or outdated data | Leads to wrong decisions based on stale data |
| Misaligned metrics | Shows data that doesn’t answer stakeholders’ needs |
| No context or benchmarks | Makes it hard to interpret performance |
Conclusion
Custom dashboards turn raw data into strategic insight—when built correctly. By understanding stakeholder needs, choosing relevant metrics, and using clear design and automation, you create tools that drive better, faster decisions.
Remember: dashboards are never “done.” As your business and goals evolve, so should the way you communicate data.
Launch Your App Today
Ready to launch? Skip the tech stress. Describe, Build, Launch in three simple steps.
Build


