In the modern business landscape, data is the currency of decision-making. From early-stage startups to multinational corporations, the ability to track performance, monitor finances, and analyze market trends is critical for survival and growth. At the heart of this process lies the humble report a document or dashboard designed to synthesize raw data into actionable insights. However, for many teams, report creation remains one of the most tedious, time-consuming, and error-prone tasks in their weekly workflow.
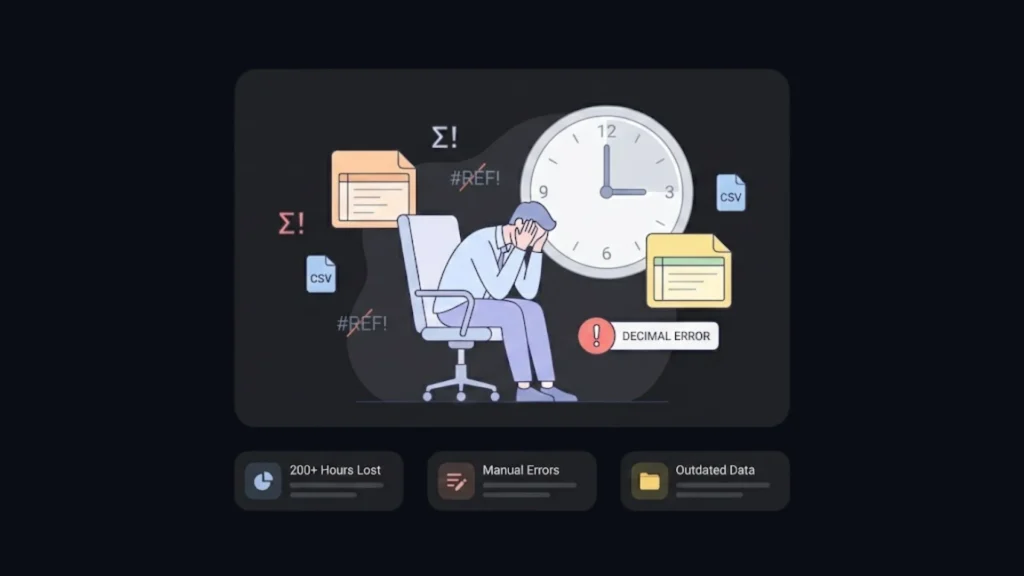
The traditional reporting process often looks like this: a marketing manager downloads a CSV file from an ad platform, an operations lead manually copies rows from one spreadsheet to another, and a finance analyst spends hours formatting pivot tables to ensure the font sizes match. This manual approach is not just inefficient; it is a bottleneck that delays critical decisions. By the time a report is finalized and distributed, the data it contains is often already outdated.
Launch Your App Today
Ready to launch? Skip the tech stress. Describe, Build, Launch in three simple steps.
BuildThe good news is that we have entered a new era of business intelligence. Artificial Intelligence (AI) and no-code technology have converged to democratize automation, making it possible to automate reports and dashboards without writing a single line of code. AI-powered reporting tools have fundamentally changed the game, transforming reporting from a retroactive chore into a proactive competitive advantage.
This comprehensive guide will walk you through the revolution of AI-driven report automation. We will explore the tangible benefits, the mechanics of no-code platforms, a detailed framework for building your first automated system, and how tools like Imagine.bo are bridging the gap between simple automation and full-scale application development.
The Hidden Cost of Manual Reporting
To understand the value of automation, we must first confront the hidden costs of manual reporting. It is easy to underestimate the burden of “just updating the spreadsheet,” but when aggregated over weeks and months, the drain on resources is massive.
The Time Sink
Consider a mid-sized sales team. If a sales manager spends four hours every Monday compiling weekly performance stats, that amounts to over 200 hours a year essentially five full work weeks dedicated solely to copy-pasting data. This is time that could be spent coaching the team, closing deals, or developing strategy. Across an entire organization, thousands of hours are lost to the mechanical assembly of reports.
The Risk of Human Error
Manual data entry is a breeding ground for errors. A misplaced decimal point, a copy-paste mistake, or a broken formula can lead to disastrous consequences. In finance, a reporting error can lead to regulatory fines or misguided budget allocations. In marketing, it might lead to overspending on an underperforming campaign. AI systems do not get tired, distracted, or bored; they process data with consistent precision, eliminating the “fat finger” errors that plague manual workflows.
The Lag in Decision Making
In a fast-paced market, speed is everything. If it takes a week to generate a monthly performance report, leadership is making decisions based on data that is already a week old. Automated AI reporting functions in real-time or near real-time. This agility allows businesses to pivot instantly shutting down a failing ad set within hours rather than days, or restocking a trending product before it sells out.
It is essential to find ways to automate your business tasks to regain this lost time and ensure agility.
Understanding AI-Driven Report Automation
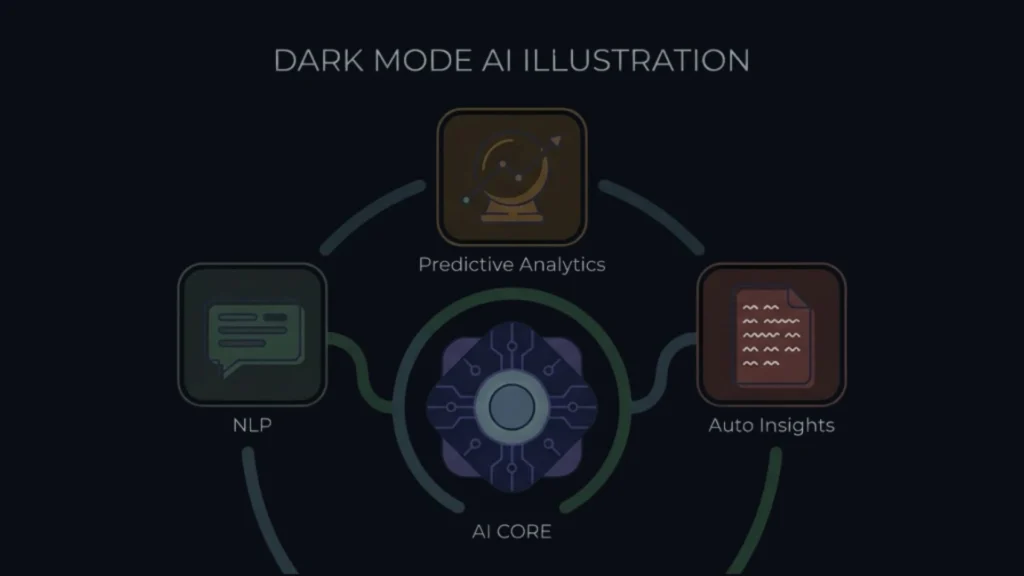
AI-driven report automation is the intersection of three technologies: data integration, machine learning (ML), and workflow automation. It is the process of using software to automatically gather data from disparate sources, process it using intelligent algorithms, and present it in a human-readable format.
Unlike traditional automation, which simply follows a rigid set of “if-this-then-that” rules, AI-driven automation adds a layer of intelligence. It doesn’t just move data; it can clean it, analyze it, and even generate narrative insights.
How It Works Under the Hood
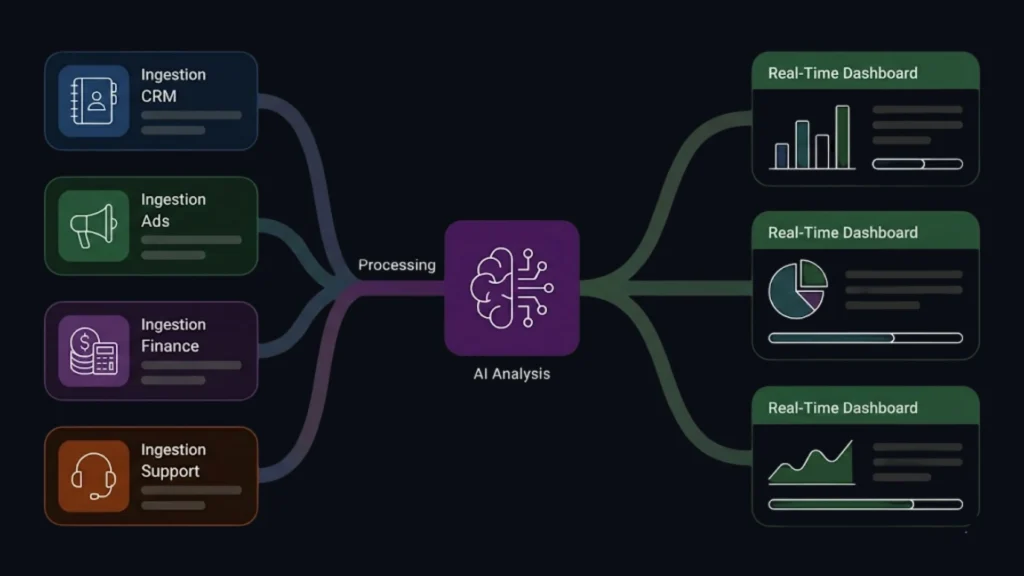
- Ingestion: The system connects to your data sources via APIs (Application Programming Interfaces). This could be your CRM (Salesforce, HubSpot), your accounting software (Xero, QuickBooks), or your project management tools (Jira, Asana).
- Processing & Cleaning: AI algorithms scan the incoming data. They identify outliers, standardize formats (e.g., converting all currency to USD), and merge duplicate records. This step is crucial for maintaining a “single source of truth.”
- Analysis: This is where the “AI” shines. Machine learning models can look for trends, anomalies, or correlations that a human might miss. For example, an AI model might notice that sales dip every time a specific competitor lowers their prices.
- Visualization & Distribution: The processed data is mapped to visual widgets charts, graphs, heatmaps and compiled into a dashboard or PDF. Finally, the system triggers the delivery, emailing the report to stakeholders or alerting them via Slack/Teams. This seamless process is key when creating custom dashboards for stakeholders who require up-to-the-minute accuracy.
The Rise of No-Code AI Platforms
Historically, building an automated reporting pipeline required a team of data engineers. You needed someone to write SQL queries to extract data, someone to build Python scripts for transformation, and a frontend developer to create the dashboard. This high barrier to entry meant that only large enterprises could afford true automation.
No-code AI platforms have dismantled these barriers. These tools provide a visual abstraction layer over complex coding processes, allowing non-technical users (“citizen developers”) to build powerful data workflows.
Why No-Code Changes Everything
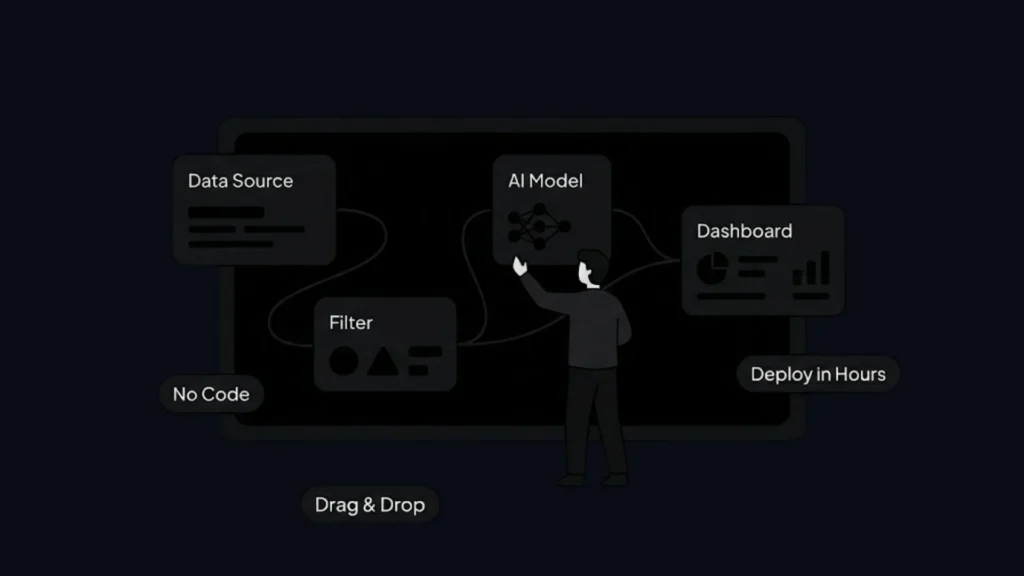
1. Drag-and-Drop Simplicity Modern platforms use intuitive interfaces where you connect blocks to define logic. Want to pull data from Google Sheets? Drag the “Google Sheets” block onto the canvas. Want to filter for sales above $1,000? Add a “Filter” block. It is programming logic without the syntax.
2. Pre-Trained AI Models You don’t need to be a data scientist to use AI. No-code platforms come with “off-the-shelf” models.
- Sentiment Analysis: Automatically tag customer feedback as positive, negative, or neutral.
- Forecasting: Use historical data to predict next month’s revenue with a single click.
- Anomaly Detection: Automatically flag a transaction that looks suspicious.
3. Speed to Deployment In the traditional software development lifecycle, a reporting dashboard could take months to scope, build, test, and deploy. With the top no-code tools, a functional prototype can be built in an afternoon, and a production-ready system in a few days. This allows for rapid iteration; if the report isn’t useful, you can change it instantly without submitting a ticket to the IT department.
Step-by-Step Framework: Building Your First AI-Powered Report
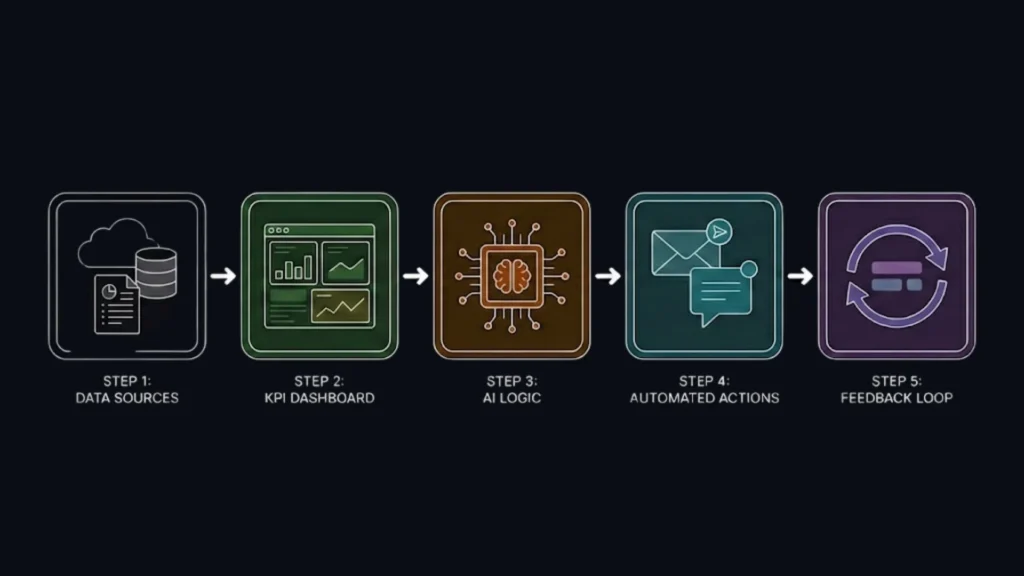
If you are ready to transition from manual spreadsheets to automated AI insights, follow this five-step framework. This approach minimizes implementation risk and ensures you build a system that actually solves a business problem.
Step 1: Data Integration and Preparation
Before you open any tool, map out your data ecosystem. Where does the information live?
- Identify Sources: List every tool that contains data relevant to the report. (e.g., Shopify for sales, Facebook Ads for marketing cost, Zendesk for customer support).
- Assess Data Hygiene: AI is a multiplier; it multiplies the quality of your data. If you feed it garbage, you will get automated garbage at scale. Spend time cleaning your source data standardizing naming conventions and filling in missing fields.
- Connect: Use your chosen no-code platform to authorize connections to these data sources. Most tools use OAuth, so you can log in securely without handling API keys manually.
Step 2: Define Report Structure and KPIs
Don’t just automate the old report rethink it. Manual reports are often cluttered because they are hard to create, so people stuff everything into one document. With automation, you can create specific, lean dashboards for different audiences.
- Audience Mapping: What does the CEO need to see? (High-level trends, revenue). What does the marketing manager need? (Click-through rates, campaign spend).
- KPI Selection: Choose metrics that drive action. Avoid “vanity metrics” that look good but mean nothing.
- Visualization Strategy: Match the chart to the data. It is critical to visualize your data effectively using line charts for trends, bar charts for categorical comparison, and pie charts sparingly.
Step 3: Configure AI Logic
This is where you add intelligence to your automation.
- Data Transformation: Set up rules to aggregate data. For example, “Sum all sales from Shopify and Stripe to calculate Total Daily Revenue.”
- Apply AI Models: Use built-in AI features. For instance, if you are analyzing customer reviews, apply an NLP (Natural Language Processing) model to summarize common complaints automatically.
- Thresholds & Alerts: Define what constitutes an anomaly. “If daily website traffic drops by more than 20% compared to the 30-day average, flag this report.”
Step 4: Automate Scheduling and Delivery
Reports are useless if nobody looks at them.
- Triggers: Set the frequency. Operational reports might need to be daily; strategic reports might be monthly.
- Delivery Channels: Meet your users where they are. Don’t force them to log into a new dashboard if they live in their inbox. Configure the system to email a PDF summary every Monday morning or post a snapshot to a dedicated Slack channel.
- Conditional Reporting: Set up “exception reporting.” This means the system stays silent if everything is normal but sends an urgent alert if specific criteria are met (e.g., “Inventory low”).
Step 5: Test, Refine, and Monitor
Do not trust the “black box” immediately.
- Parallel Runs: For the first month, run your manual process alongside the automated one. Compare the numbers. If there is a discrepancy, investigate the logic.
- User Feedback: Ask the recipients if the report is helpful. Is it too dense? Is it missing context?
- Iterate: The beauty of no-code is flexibility. Tweak the layout, add new metrics, or change the schedule based on feedback.
Advanced Automation Techniques
Once you have mastered the basics, you can leverage advanced AI capabilities to turn your reporting system into a strategic engine.
Natural Language Processing (NLP)
Imagine asking your data a question like you would ask a colleague. Advanced AI platforms support NLP interfaces where users can type, “Show me the top 3 selling products in California last December,” and the system generates the chart on the fly. This “self-service” analytics reduces the burden on data teams, as stakeholders can answer their own ad-hoc questions.
Predictive Analytics & Forecasting
Descriptive reporting tells you what happened. Predictive reporting tells you what will happen. By consulting a predictive analytics guide, you can learn to use regression models and time-series analysis to forecast future performance.
- Sales Forecasting: Predict Q4 revenue based on Q1-Q3 trends and historical seasonality.
- Churn Prediction: Identify which customers are at high risk of cancelling based on their usage patterns, allowing customer success teams to intervene before it’s too late.
Narrative Generation (NLG)
Natural Language Generation (NLG) is the flip side of NLP. It allows the AI to write a textual summary of the charts. Instead of just showing a graph with a downward spike, the report includes a generated paragraph: “Revenue decreased by 15% this week, primarily driven by a shortage of inventory in the Electronics category, despite a 5% increase in web traffic.” This provides context instantly.
Real-World Use Cases
Finance: The Automated CFO
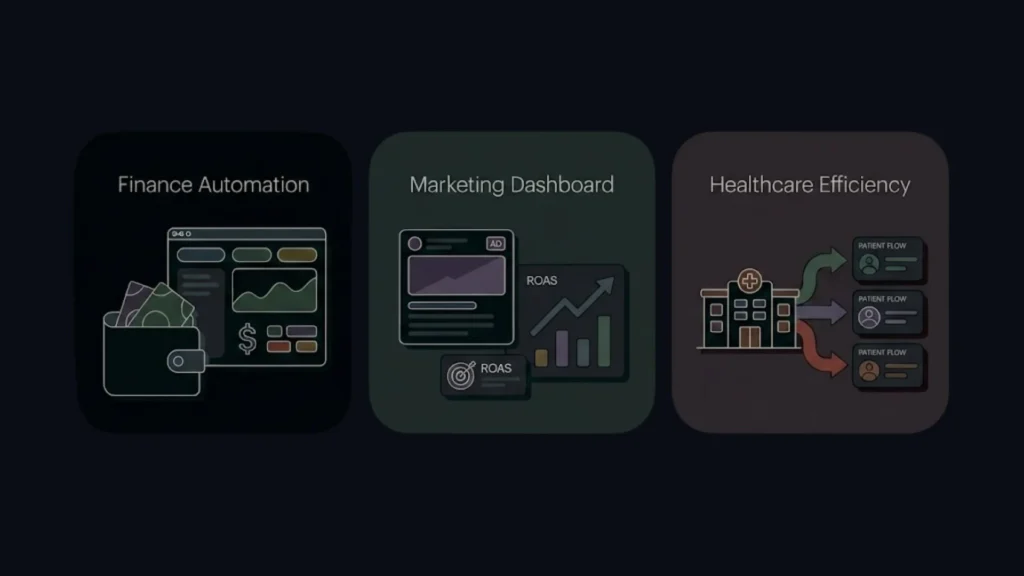
A finance team uses AI automation to streamline expense management. The system pulls transaction data from credit card feeds and bank accounts. An AI model categorizes each transaction (e.g., “Software Subscription,” “Travel,” “Meals”). It flags duplicates or policy violations (e.g., a meal expense exceeding the daily limit). The CFO receives a real-time dashboard of burn rate and cash flow, rather than waiting 15 days after month-end for the books to close.
Marketing: The Omni-Channel Dashboard
A digital agency manages ads across Google, Facebook, TikTok, and LinkedIn. Previously, they spent Mondays screenshotting charts for client reports. Now, they utilize a robust marketing automation guide to pull API data from all platforms into a unified dashboard. It calculates a blended ROAS (Return on Ad Spend) and uses AI to recommend budget reallocations suggesting moving money from Facebook to TikTok based on current performance trends.
Healthcare: Patient Efficiency
A clinic uses automated reporting to track patient flow. The system analyzes check-in and check-out times to identify bottlenecks in the waiting room. Predictive models forecast high-volume days based on flu season trends, allowing the clinic to schedule extra staff in advance.
Where Imagine.bo Fits In
As businesses mature in their automation journey, they often hit a ceiling. No-code reporting tools are fantastic for internal dashboards, but what if you want to build a customer-facing product? What if you want to turn your internal analytics tool into a SaaS (Software as a Service) platform to sell to others?
This is where Imagine.bo enters the conversation. Imagine.bo is an AI-powered no-code app builder that allows you to start building your app for free, bridging the gap between simple automation and complex software engineering.
From Report to Product
Many successful startups began as internal tools. Perhaps you have built an incredible automated system for tracking SEO performance. You realize other agencies would pay for this. Standard reporting tools can’t easily be “productized” with user logins, payment gateways, and tiered access.
Imagine.bo allows you to describe this product in plain English. You can easily transform spreadsheet to SaaS by saying, “Build a SaaS platform where users can connect their Google Search Console, and it generates a weekly SEO health report with AI-driven recommendations. Include a subscription payment system.”
The Imagine.bo Advantage
- AI Reasoning & Architecture: Unlike basic drag-and-drop builders, Imagine.bo acts as a senior software architect. It understands business logic. It knows that a SaaS platform needs a database, an authentication system (login/signup), and a frontend. It generates the architecture based on best practices.
- Scalable Backend: Reports involve data. Apps involve lots of data. Imagine.bo builds on SDE-level (Software Development Engineer) standards. It ensures the backend can handle thousands of concurrent users, complex queries, and secure data storage.
- Cloud-Native Deployment: It handles the DevOps nightmare. Deployment to cloud providers like AWS, GCP, or Vercel is automated. You don’t need to know how to configure a server or set up an SSL certificate.
- Security & Compliance: When you move from internal reports to external products, security is paramount. Imagine.bo incorporates enterprise-grade security protocols, ensuring data encryption and secure API handling.
For founders and innovators, Imagine.bo is the catalyst that turns a “reporting workflow” into a “revenue-generating asset.” It allows non-technical entrepreneurs to launch their own platform that previously required a million-dollar seed round and a team of engineers.
Best Practices for Long-Term Success
Implementing AI reporting is a journey, not a one-time setup. To ensure long-term value, adhere to these principles:
1. Governance and Security Democratizing data is powerful, but dangerous. Ensure you have strict permissions. Not everyone needs to see payroll data or profit margins. Use the Role-Based Access Control (RBAC) features in your no-code platform to restrict visibility.
2. Maintain Human Oversight AI is a tool, not a replacement for judgment. A sudden spike in sales might look great to an AI, but a human knows it was caused by a pricing error that needs to be fixed. Always keep a “human in the loop” for critical decisions.
3. Documentation Even no-code needs documentation. If the person who built the automation leaves the company, does anyone else know how it works? Distinctively label your workflows and maintain a simple “How-To” guide for your internal tools.
4. Start Small, Then Scale Do not try to automate the entire company’s reporting in week one. Pick one painful report perhaps the weekly sales update and automate that. Success builds momentum. Once the team sees the time saved, they will focus on scaling SaaS with automation to expand these benefits across the organization.
5. Track ROI Quantify the impact. “We saved 15 hours a week,” or “We reduced reporting errors by 90%.” These metrics justify the investment in the tools and help secure budget for more advanced features like Imagine.bo.
The Future of Reporting
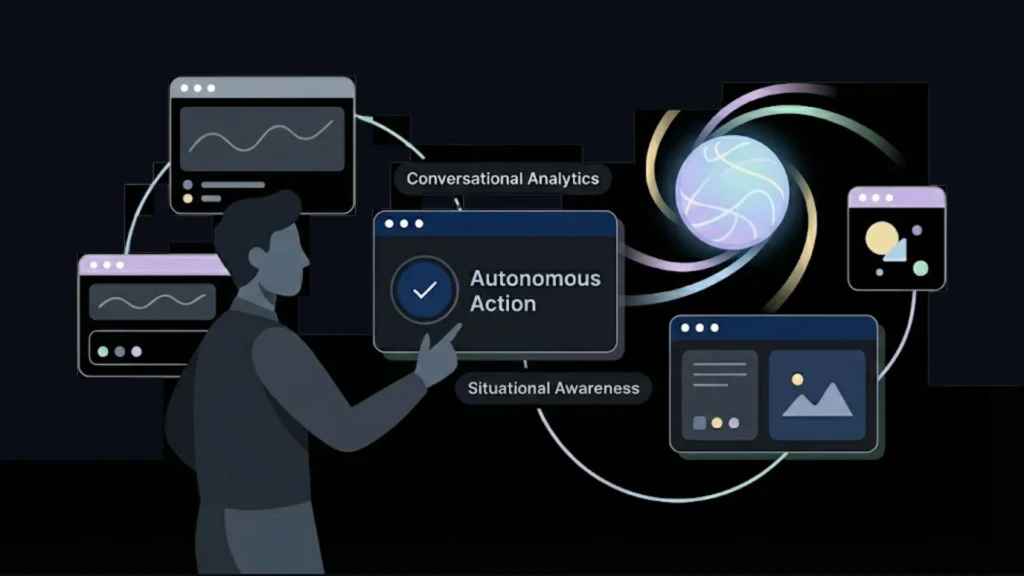
We are rapidly moving toward a future where “reporting” as a distinct task disappears. Instead of “running a report,” we will simply have “situational awareness.”
Conversational Interfaces
Dashboards will become less static and more conversational. You will wake up and ask your phone, “How is the business doing?” and the AI will synthesize data from sales, marketing, and operations to give you a spoken briefing, highlighting only what requires your attention.
Autonomous Action
The next leap is from insight to action. Future AI reporting systems won’t just tell you that inventory is low; they will ask, “Inventory for SKU-123 is low. Should I reorder 500 units from the supplier?” You will simply click “Yes.”
The Strategic Shift
As the mechanical work of data gathering vanishes, the role of the analyst shifts. The value of a human will not be in finding the data, but in interpreting the nuance and devising strategy. We are moving from a world of “Data Entry Clerks” to a world of “Data Architects” and “Strategic Planners.”
Conclusion
Automating your reports with AI is one of the highest-leverage activities a modern business can undertake. It liberates your team from the drudgery of data assembly, eliminates the risks of human error, and provides the real-time visibility needed to navigate a volatile market.
The barrier to entry has never been lower. With no-code platforms, the power to build complex, intelligent data pipelines is accessible to anyone with a clear understanding of their business logic. You do not need a computer science degree; you need curiosity and a willingness to experiment.
Furthermore, as you refine your automated insights, opportunities arise to transform these internal efficiencies into external products. Tools like Imagine.bo stand ready to help you bridge that gap, empowering you to define the future of app development by building scalable, secure, and profitable applications on top of your data insights.
The days of manual spreadsheets and late-night reporting marathons are ending. The future is automated, intelligent, and instantaneous. The only question remaining is: are you ready to stop reporting on the past and start engineering the future?
Launch Your App Today
Ready to launch? Skip the tech stress. Describe, Build, Launch in three simple steps.
Build