Your shipments deserve better than Excel rows. Build a custom supply chain tracker with AI delay predictions in one afternoon—no coding required. Get real-time visibility, automated alerts, and predictive analytics. See how modern logistics teams are replacing spreadsheets with purpose-built dashboards.
Your shipment shouldn’t be a row in Excel. It should be a live data point.
Right now, there’s a $50K shipment somewhere between Shanghai and Seattle. Your operations manager is staring at a three-day-old spreadsheet update, refreshing the carrier’s website every hour, and fielding angry calls from customers asking “where’s my order?” According to Slimstock’s research on AI versus spreadsheets, Excel-based inventory tracking costs companies a 67% effectiveness loss compared to real-time systems.
The problem isn’t your team. It’s the tools.
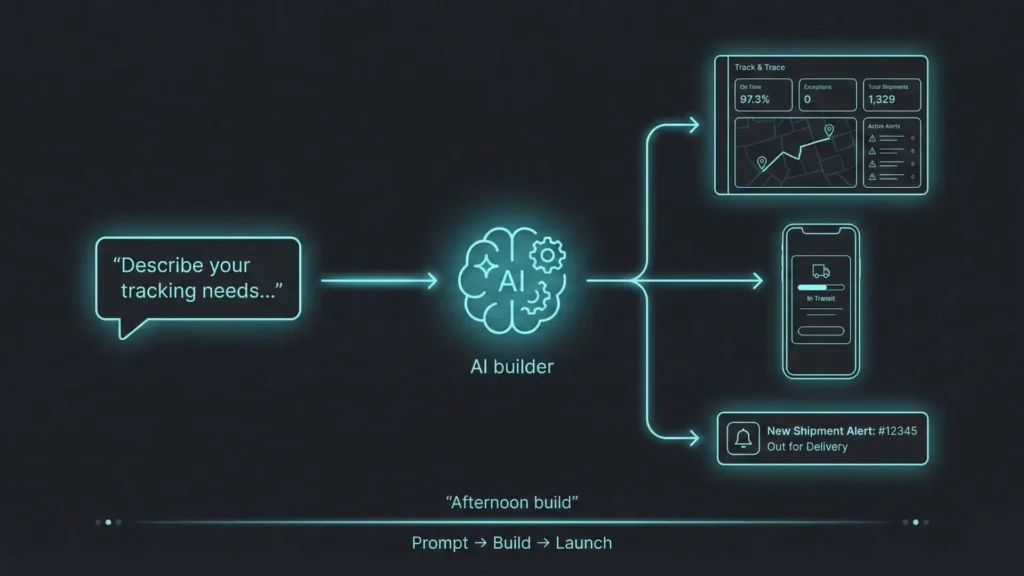
What if you could build a custom track-and-trace dashboard—complete with AI-powered delay predictions—in a single afternoon, without writing a single line of code? Not a template. Not a workaround. A purpose-built supply chain visibility platform that connects to your carrier APIs, learns from your historical data, and alerts you to problems before they become crises.
This isn’t hypothetical. It’s happening right now with modern AI app builders that understand business logic, not just visual layouts.
Why Spreadsheets Are Killing Your Supply Chain
Excel wasn’t designed for supply chain management. It was designed for calculations, not coordination.
The moment you export tracking data to a CSV file, it becomes historical. By the time someone manually updates row 247 with “Delayed—Weather,” that container has either cleared customs or missed its connection. Real-time data becomes stale data within hours, creating a dangerous gap between what you think is happening and what’s actually happening on the ground.
Manual updates create bottlenecks that compound across your organization. Your logistics coordinator spends two hours each morning copying tracking numbers from carrier emails into spreadsheet cells. Your customer service team can’t answer basic questions without calling operations. Your executives make decisions based on data that’s already obsolete by the time it reaches their inbox.
Consider this scenario: A mid-sized furniture importer receives 50 containers monthly from Vietnam. Their process: Export shipping schedules from their freight forwarder’s portal, email them to operations, manually enter tracking numbers into a master Excel file, and check carrier websites individually for updates. When a container gets delayed at the port, they discover it 48 hours later—when the customer calls asking why their delivery is late.
The hidden costs multiply quickly. Those 48 hours meant rush fees to rebook trucking, premium charges for expedited warehouse processing, and a lost customer relationship worth $200K annually. The spreadsheet didn’t fail because of bad data. It failed because spreadsheets can’t predict, can’t alert, and can’t scale.
Research from Schneider Electric emphasizes the difference between “walled silos” of disconnected data and a “single source of truth” that provides unified visibility. Your spreadsheet creates silos. Every team member maintains their own version. Nobody knows which file has the current information. Critical updates get lost in email threads.
Security and collaboration limitations make the problem worse. When your supply chain data lives in Excel files passed through email, you can’t control who sees what. Your freight costs and supplier relationships are exposed in unencrypted attachments. Version control becomes a nightmare of filenames like:
"Q4_Shipments_FINAL_v3_revised_USE_THIS_ONE.xlsx."The fundamental issue: Spreadsheets have no predictive intelligence. They can’t tell you that the typhoon approaching Taiwan will delay your electronics shipment by five days. They can’t learn that Container Line A always runs three days behind schedule during holiday season. They can’t automatically alert your team when a shipment deviates from its expected route.
You need a system that thinks, not just stores numbers.
The Architecture of Modern Supply Chain Visibility
Real supply chain visibility requires three synchronized layers working together in real-time.
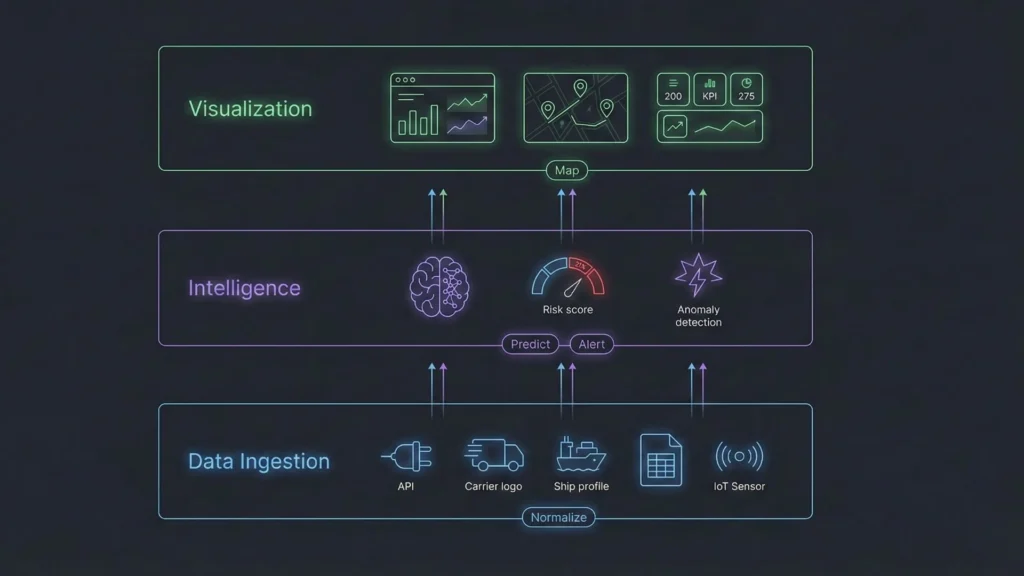
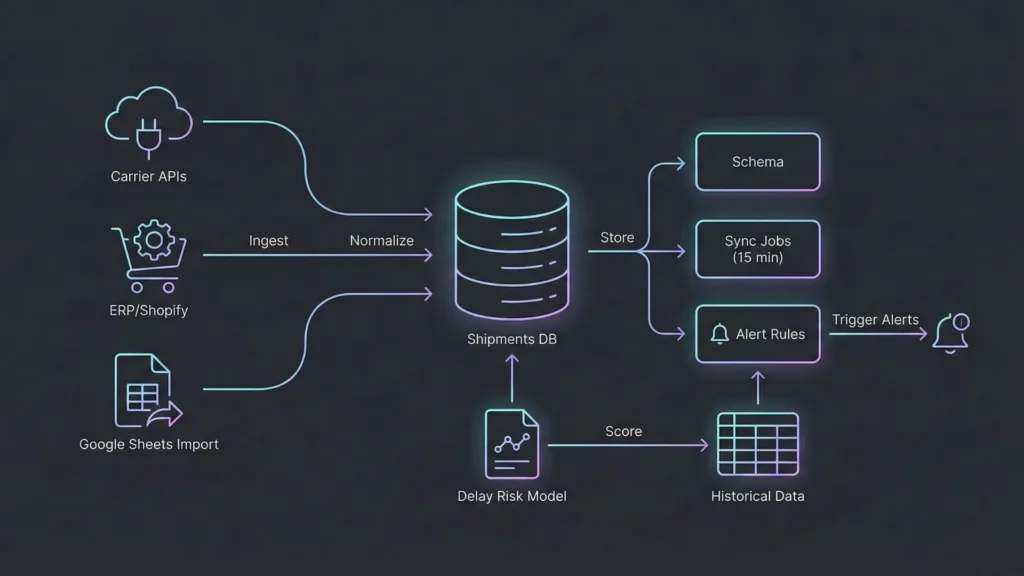
According to Fullestop’s architecture of visibility framework, effective tracking systems follow a clear structure: Data Ingestion → Intelligence → Visualization. Each layer serves a specific purpose, and all three must work seamlessly.
The Data Ingestion Layer connects directly to your data sources without manual intervention. This means API integrations with FedEx, UPS, DHL, Maersk, and every carrier you use. It means pulling order data from your Shopify store or ERP system automatically. It includes IoT sensors that report container temperature and GPS location every 15 minutes.
Modern ingestion layers normalize disparate data formats into a unified structure. FedEx uses different status codes than UPS. Your freight forwarder’s portal has different field names than your warehouse management system. The ingestion layer translates everything into a common language your business can understand.
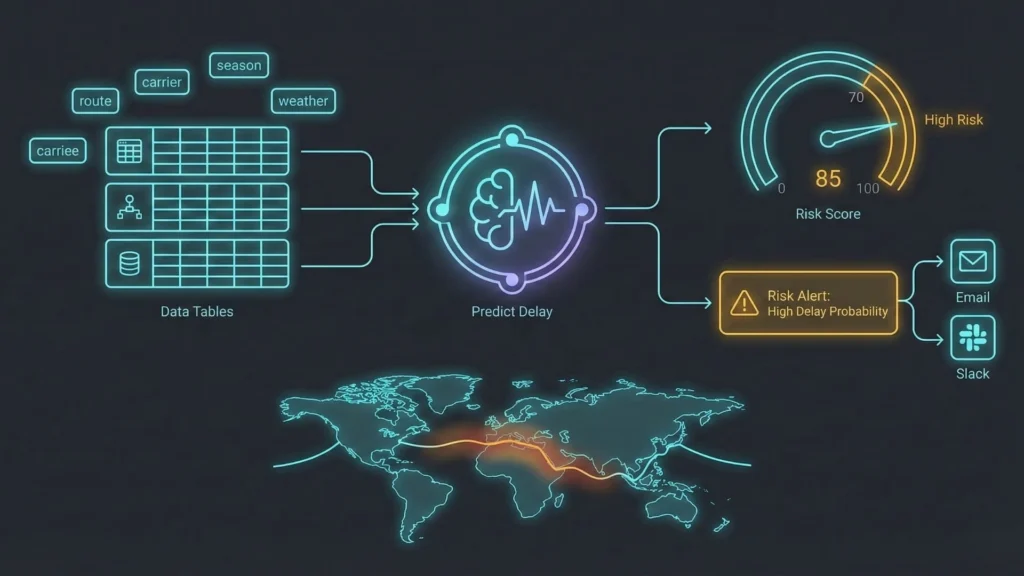
The Intelligence Layer is where AI reasoning transforms raw data into actionable insights. This layer analyzes historical shipment patterns to calculate risk scores for new shipments. It detects anomalies—when a package that normally takes three days to clear customs has been sitting there for five days, the system flags it automatically.
Predictive capabilities emerge from this layer. By examining thousands of past shipments, the intelligence layer learns that Route A through the Port of Los Angeles experiences 40% more delays during October-December compared to Route B through Oakland. When you book a new shipment, it calculates the probability of on-time delivery based on carrier, route, season, and package type.
The intelligence layer also manages automation rules. If a high-priority shipment’s estimated delivery date slips by more than 24 hours, send an alert to operations and customer service immediately. If a container sits at the same location for 48 hours without movement, escalate to the freight forwarder. These rules run continuously, monitoring every shipment without human intervention.
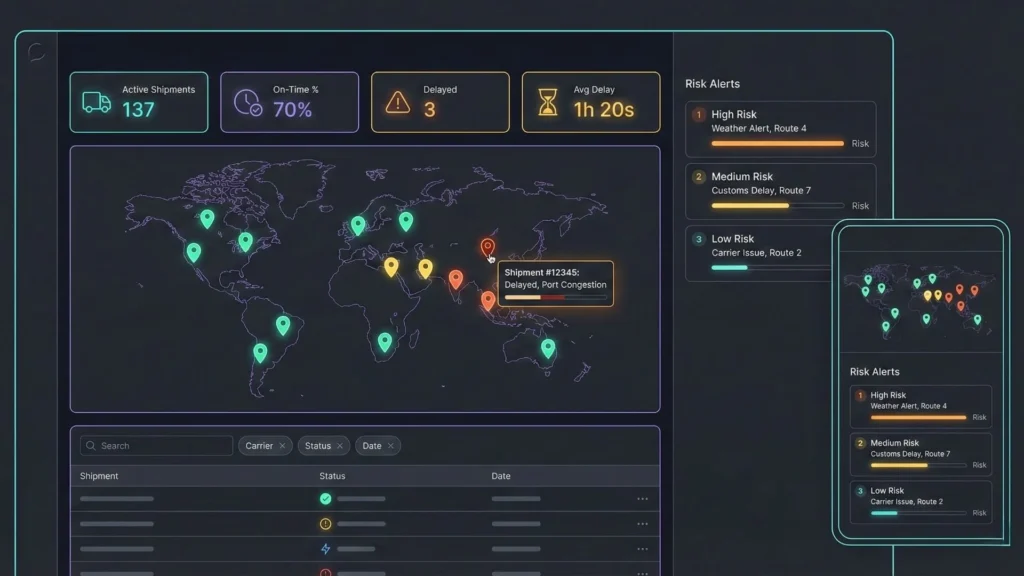
The Visualization Layer presents complex data through intuitive interfaces that non-technical users understand. Interactive maps show all active shipments with color-coded status indicators—green for on-time, yellow for at-risk, red for delayed. Drill-down capabilities let you click any shipment icon to see its complete history, current location, and predicted arrival time.
Dashboard components display key metrics at a glance: total active shipments, on-time delivery percentage, average delay duration, and exception count. Filterable data tables let operations managers search by tracking number, customer, carrier, or status. Mobile-responsive designs ensure warehouse managers can check shipments from their phones while walking the floor.
GoodData’s visualization examples demonstrate how effective dashboards balance information density with clarity. Too much data creates overwhelm. Too little data hides problems. The right balance provides exactly what each user role needs to make decisions.
ClickUp’s KPI framework for supply chain emphasizes metrics that matter: On-Time In-Full (OTIF) delivery rate, lead time variability, exception rate by carrier, and cost per shipment. Your visualization layer should surface these metrics automatically, calculated from real-time data without manual reporting.
Traditional platforms require data engineers to architect these three layers, configure API connections, write transformation scripts, and design dashboards. That process takes months and costs tens of thousands of dollars.
With no-code AI platforms like Imagine.bo, the AI reasoning engine builds this entire architecture through conversation. You describe your requirements in plain English. The AI maps your data sources, generates the backend logic, trains prediction models, and creates the visualization layer—automatically.
Building Your Track & Trace Dashboard: The Imagine.bo Method
The difference between traditional development and AI-powered app building is how you communicate what you want to build. Instead of writing specifications documents and technical requirements, you have a conversation.
Phase 1: Define Your Tracking Requirements
Start by explaining your business context and pain points to the AI in natural language.
Example Prompt:
I need a supply chain tracking dashboard for my e-commerce fulfillment operation. I ship 200-500 packages daily via FedEx, UPS, and DHL.

Current pain points:
- Manually checking carrier websites for status updates
- Customer service team spends 3 hours/day answering "Where's my order?"
- No visibility into which shipments are at risk of delay

I have historical shipment data in Google Sheets (6 months, ~10K shipments) with:
- Tracking numbers, carrier, origin/destination, ship date, expected delivery date, actual delivery date, delay reason codes

I want to:
1. See all active shipments on a live map
2. Get automatic alerts when a shipment is delayed
3. Predict which shipments might be delayed based on historical patterns
4. Generate weekly performance reports by carrier
This single prompt contains everything Imagine.bo’s AI reasoning engine needs to architect your solution. Unlike visual no-code builders that require you to drag-and-drop components without understanding your business logic, AI-powered platforms interpret requirements and make architectural decisions.
The AI identifies required data entities: Shipments, Carriers, Routes, Customers, and Alerts. It maps business logic automatically—a shipment is “delayed” when actual delivery exceeds expected delivery by more than 24 hours. It recommends integrations with carrier APIs and Google Sheets import functionality. It even suggests a machine learning model for delay prediction based on route, carrier, season, and package type.
You don’t need to know database design. You don’t need to understand REST APIs. You describe what you need, and the AI translates that into production-ready architecture.
Phase 2: AI Builds Your Data Architecture
Once the AI understands your requirements, it generates the complete backend infrastructure automatically.
Database Schema Generation: The system creates a relational database with properly normalized tables:
- Shipments table: tracking_id, carrier, status, origin, destination, ship_date, expected_delivery, actual_delivery, delay_flag, customer_id
- Historical_patterns table: route_id, carrier, average_delay_days, risk_score, seasonal_factor
- Alert_rules table: condition, notification_channel, recipient, priority_level
- Customers table: customer_id, name, email, notification_preferences
Backend Logic: API connectors to carrier tracking systems get configured automatically. The AI determines which carrier APIs to use, handles authentication, and sets up scheduled refresh jobs that poll for updates every 15 minutes. When new tracking data arrives, the system compares it against expected values and updates status flags.
Delay prediction models train on your historical data without requiring data science expertise. The AI analyzes patterns in your Google Sheets data—routes that consistently run late, carriers with higher delay rates during specific seasons, package types that experience more exceptions. It creates a lightweight ML model that scores new shipments on a 0-100 risk scale.
Alert trigger workflows activate based on your specified conditions. When a shipment’s delay flag changes from false to true, the system sends notifications through your preferred channels—email, Slack, SMS, or in-app alerts. Operations managers receive immediate notification, not a report at the end of the day.
This is where Imagine.bo’s approach differs fundamentally from traditional no-code builders. Platforms like Bubble or Webflow require you to manually configure database relationships, write conditional logic formulas, and debug API integrations. Imagine.bo generates production-grade backend code—scalable to 1,000 transactions per second, with secure data handling and clean separation of concerns.
The architecture isn’t constrained by visual builder limitations. You’re not working around tool restrictions or accepting “close enough” solutions. The AI writes actual code that a senior developer would write, following industry best practices for performance, security, and maintainability.
Phase 3: Design Your Dashboard Interface
With the backend infrastructure ready, describe how you want users to interact with your system.
Example Prompt:
Create a dashboard with:
- Top section: Key metrics cards (Active Shipments, On-Time %, Delayed Shipments, Average Delay Hours)
- Middle section: Interactive map showing shipment locations with color coding (green=on-time, yellow=at-risk, red=delayed)
- Bottom section: Data table with filters (carrier, status, date range) and search by tracking number
- Right sidebar: Delay prediction alerts ranked by risk score

Make it mobile-responsive for warehouse managers to check on phones.
Imagine.bo translates this description into a complete user interface. It selects appropriate component libraries—metric cards with real-time updates, map integration using Mapbox or Google Maps, filterable data tables with server-side pagination, and responsive layout grids that adapt to screen sizes.
The AI applies modern UI/UX principles automatically. Metric cards use color psychology—green for positive trends, red for alerts. The map view provides intuitive zoom and pan controls. Data tables include column sorting, bulk actions, and export functionality. Mobile layouts prioritize the most important information, collapsing secondary details into expandable sections.
Real-time data binding ensures the dashboard updates without page refreshes. When a shipment’s status changes in the database, the map marker updates immediately. When a new delay prediction triggers, the alert sidebar updates instantly. Users see live data, not stale snapshots.
You don’t need design skills to create professional interfaces. The AI understands that executives need high-level metrics, operations managers need detailed shipment lists, and warehouse staff need mobile-optimized task views. It generates appropriate interfaces for each user role based on your description.
Phase 4: Add Predictive Intelligence
The real value of custom software emerges when you embed AI capabilities that spreadsheets could never provide.
Example Prompt:
Analyze my historical shipment data to predict delays. Use these factors:
- Carrier performance by route
- Seasonal patterns (holiday shipping)
- Weather events in origin/destination regions
- Package type and special handling requirements

When a new shipment is created, calculate a risk score (0-100). If score > 70, send an alert to the operations team via email and Slack.
Imagine.bo ingests your Google Sheets historical data and performs feature engineering automatically. It identifies correlations between delays and various factors—certain routes consistently take longer, specific carriers perform worse during December, packages requiring refrigeration have higher exception rates.
The system trains a predictive model without requiring you to understand gradient boosting or neural networks. It splits your historical data into training and validation sets, tests multiple algorithms, and selects the best-performing model. This happens in the background while you describe what you want to achieve.
When you create a new shipment record, the model calculates a risk score instantly. A package shipping from Los Angeles to New York via Carrier X in July might score 25 (low risk). The same route in December scores 78 (high risk) because historical data shows 40% delay rate during holiday season.
Automated scoring triggers notification workflows. The operations team receives a Slack message: “High-risk shipment detected: Tracking #XYZ123 has 75% predicted delay probability. Consider upgrading to express shipping or notifying customer proactively.” This proactive alert prevents the surprise delays that damage customer relationships.
Datakulture’s guide to supply chain disruption prediction typically requires hiring data scientists, setting up Jupyter notebooks, and maintaining complex ML pipelines. Imagine.bo embeds this intelligence into your app through plain-English instructions. The AI handles feature selection, model training, deployment, and monitoring automatically.
Your competitive advantage isn’t the algorithm—it’s the speed at which you can embed intelligence into business workflows. While competitors are still exporting CSV files and running manual analyses, you’re getting real-time predictions and automated interventions.
Phase 5: Launch & Iterate
When your dashboard is ready, deployment happens with a single click.
Imagine.bo hosts your application on enterprise-grade infrastructure—AWS or Google Cloud, with SSL certificates, DDoS protection, and automatic scaling. Performance gets tuned automatically for fast load times. Security configurations follow GDPR and SOC2 compliance standards by default.
Users access your dashboard through a custom URL: track.yourcompany.com. Mobile apps deploy to iOS and Android if needed. The system handles authentication, user permissions, and data access controls based on your organizational structure.
Iteration happens through conversation: After launching, you refine the application by describing new requirements:
“Add a customer portal where clients can track their own orders without contacting customer service.”
“Integrate with our Shopify store to automatically create shipment records when orders are fulfilled.”
“Generate a weekly PDF report emailed to executives every Monday morning showing carrier performance metrics.”
“Add a mobile app feature for delivery drivers to scan packages and update status in real-time.”
Each refinement takes minutes to hours, not weeks. The AI understands the existing architecture and adds new features without breaking existing functionality. This iterative approach matches how businesses actually work—you discover new requirements after using the system, not before building it.
Imagine.bo’s collaboration model combines AI automation with human expertise for advanced customizations. If you need complex business logic that requires domain expertise, you can work with Imagine.bo’s team to implement specialized features while maintaining the speed advantages of AI-generated code.
Real-World Applications & Use Cases
Custom supply chain tracking solves different problems across different industries. Here’s how real companies apply these capabilities.
E-commerce Fulfillment: From Chaos to Clarity
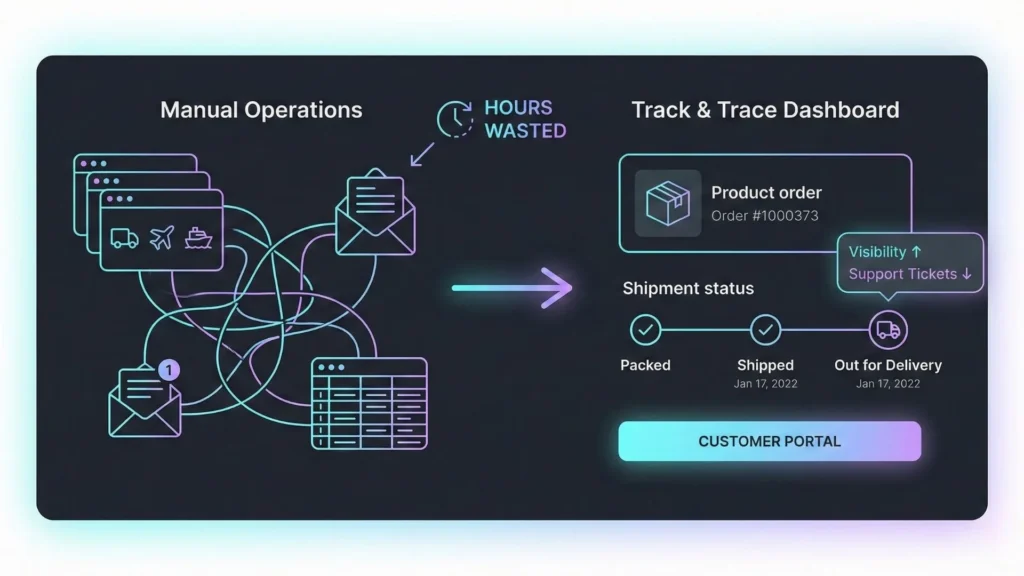
A direct-to-consumer furniture brand ships 500 orders daily through multiple carriers and fulfillment centers. Before implementing a custom tracker, their customer service team spent 25 hours weekly answering “Where’s my order?” calls. Their only visibility came from manually checking carrier websites and updating a shared Excel file.
They built an Imagine.bo dashboard with carrier API integration and customer self-service portal. When an order ships, the system automatically creates a tracking record and sends the customer a branded email with a link to check status anytime. The dashboard displays real-time location updates pulled from carrier APIs every 15 minutes.
AI delay prediction analyzes historical data to identify at-risk shipments. When a package shows signs of delay—sitting at a distribution center longer than expected—the system alerts customer service before the customer calls. Representatives reach out proactively: “We noticed your shipment might arrive a day late. We’ve applied a 15% discount to your next order and upgraded your delivery to priority.”
Results: 75% reduction in customer service inquiries about order status, 98% real-time visibility across all carriers, and NPS score increase from 42 to 67. The customer portal handles 3,000 tracking lookups weekly that previously required phone calls.
Manufacturing Inbound Logistics: Preventing Production Delays
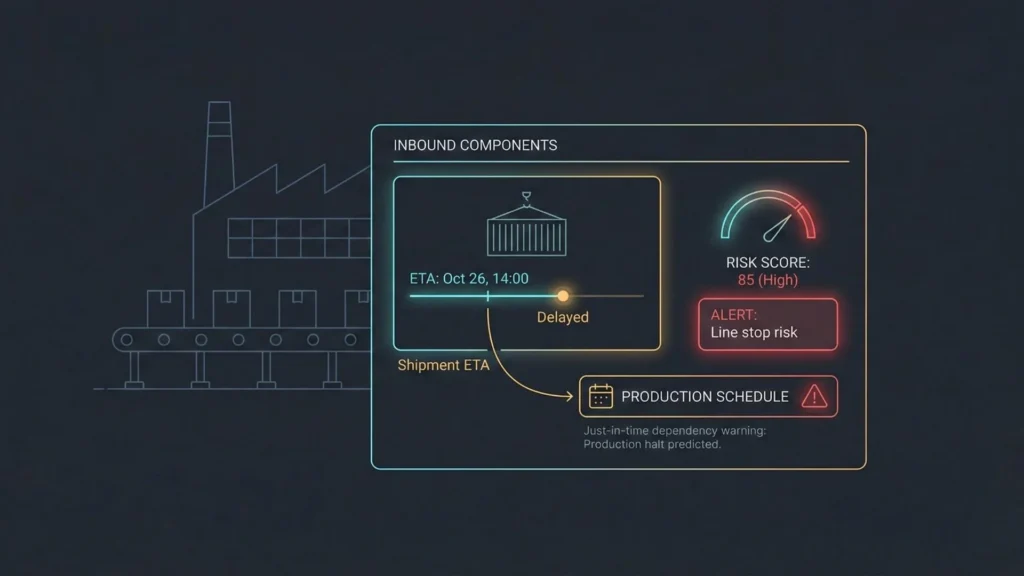
An electronics manufacturer sources components from 20 suppliers across Asia. Production planning depends on accurate arrival estimates for raw materials. A single delayed shipment can halt an entire assembly line, costing $50K per day in lost production.
Their legacy system required supply chain analysts to manually track 50-60 active shipments weekly, downloading tracking data from freight forwarder portals and emailing updates to production managers. Critical delays often went unnoticed until components didn’t arrive when expected.
They implemented a custom track-and-trace dashboard with predictive analytics. The system connects directly to freight forwarder APIs and ocean carrier tracking systems. When containers board vessels, the dashboard calculates expected arrival dates based on vessel schedules, port congestion data, and historical customs clearance times.
The AI prediction engine learns supplier reliability patterns. Supplier A consistently ships two days late. Supplier B’s shipments from Vietnam experience 30% delays during monsoon season. When production planning creates a new purchase order, the system automatically adjusts delivery estimates based on these patterns and alerts procurement if the schedule creates production risk.
Results: 40% reduction in production line stoppages due to late materials, $200K annual savings from avoided rush shipping fees, and data-driven supplier scorecards that improved negotiation leverage during contract renewals.
Third-Party Logistics (3PL) Provider: Scaling Without Developers
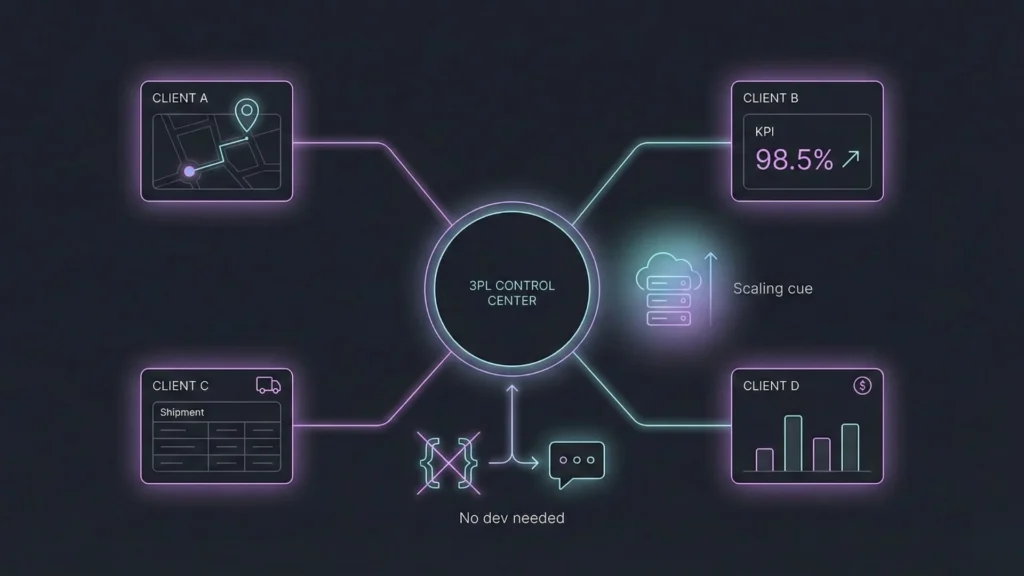
A 3PL provider manages shipments for 50 clients, each requiring custom reporting and different service level agreements. Their operations team spent 15 hours weekly generating manual reports—exporting data from their warehouse management system, formatting Excel spreadsheets, and emailing clients.
Clients demanded more visibility. Some wanted daily updates. Others needed real-time dashboards. Some required integration with their own systems. Hiring developers to build 50 custom solutions wasn’t financially viable.
They built a multi-tenant tracking platform using Imagine.bo’s scalable SaaS architecture. Each client receives a branded dashboard showing only their shipments. Client A sees delivery performance metrics. Client B sees inventory levels synchronized with shipment arrivals. Client C’s dashboard integrates with their Shopify store for automated order fulfillment.
The 3PL operations team maintains one central system rather than 50 separate reporting processes. When clients request new features—”Can you add customs documentation status to our dashboard?”—the team updates the platform through conversation with the AI rather than writing code or hiring developers.
Results: Scaled from 50 to 150 clients without adding engineering headcount, 92% client satisfaction score (up from 67%), and $400K additional annual revenue from premium visibility services that were previously impossible to offer.
Cross-Border E-commerce: Managing Complexity at Scale
An online marketplace connecting US buyers with Asian manufacturers handles 1,000+ international shipments monthly. Their logistics complexity includes customs clearance, multiple carriers, port delays, and varying documentation requirements by country.
Excel-based tracking couldn’t handle the complexity. Different teams maintained separate spreadsheets—operations tracked container movements, customs brokers tracked clearance status, customer service tracked delivery promises to buyers. Nobody had unified visibility.
They created a comprehensive tracking system that consolidates all logistics data into a single dashboard. Freight forwarder APIs provide container location and vessel schedules. Customs broker APIs show clearance status and documentation requirements. Carrier APIs track final-mile delivery.
The intelligence layer maps complex logistics workflows. When a container arrives at the Port of Los Angeles, the system checks whether all customs documentation has been filed. If documentation is incomplete, it alerts the customs broker and flags affected shipments as at-risk. When customs releases the container, it automatically notifies the drayage carrier to schedule pickup.
AI predictions account for multiple delay points—port congestion (predicted using historical data and current vessel backlog), customs clearance duration (varies by product category and origin country), and final-mile delivery time. Buyers see accurate delivery estimates that account for all these factors, not just the shipping label promise.
Results: Reduced average delivery time from 45 days to 38 days, improved delivery estimate accuracy from 60% to 89%, and decreased customer complaints by 55%.
Beyond Track & Trace—Expanding Your Supply Chain OS
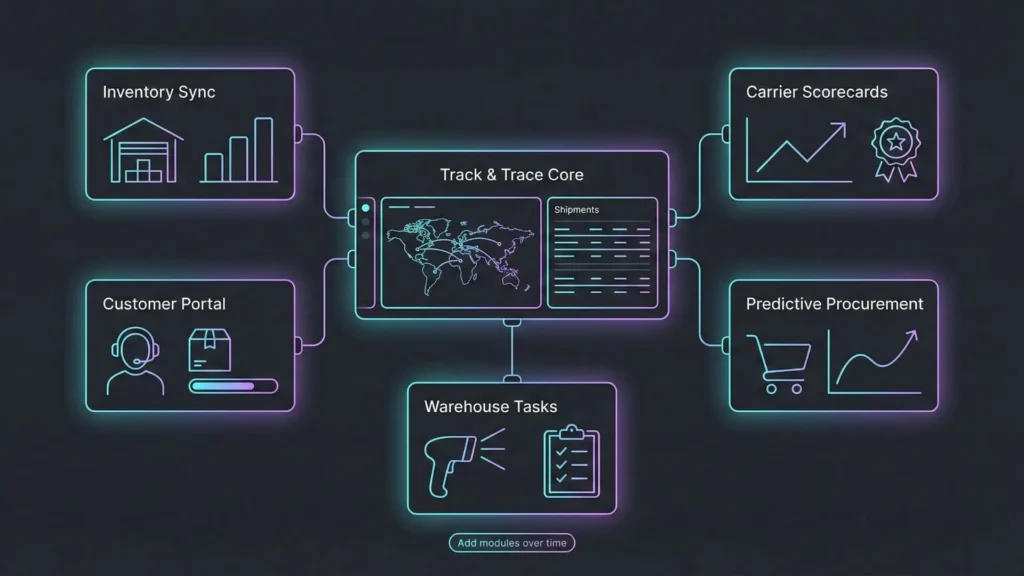
The initial tracking dashboard becomes a platform for broader supply chain optimization.
Your track-and-trace system already captures shipment data, carrier performance, delay patterns, and cost information. This data foundation enables additional modules that share the same infrastructure.
Inventory Management Integration: Link shipment arrivals to inventory levels automatically. When a container delivers to your warehouse, the system updates stock levels and triggers reorder alerts for low-stock SKUs. Read more about building inventory trackers that sync with your supply chain data.
Example Prompt:
Add an inventory module that syncs with our track & trace data. When a shipment is delivered, automatically update inventory levels and trigger reorder alerts for low-stock SKUs. If projected inventory will run out before the next shipment arrives, alert purchasing 7 days in advance.
Warehouse Task Assignment: Create mobile-optimized interfaces for warehouse staff. When containers arrive, the system generates unloading tasks assigned to specific workers. Staff scan barcodes to mark tasks complete, updating inventory in real-time. Warehouse managers see live dashboards showing task progress and worker productivity.
Carrier Performance Analytics: Historical data from your tracking system builds comprehensive scorecards. Which carriers deliver on time most consistently? Which routes experience the most delays? Which carriers offer the best cost-per-delivery ratio? Use these insights during carrier negotiations and routing decisions.
Customer Self-Service Portal: Extend your internal dashboard to customers. Clients log in to see their shipments, download documentation, and receive automated updates. Branded email notifications use your company logo and messaging. This reduces support burden while improving customer experience.
Predictive Procurement: Combine shipment tracking with sales forecasting. The system analyzes sales velocity, current inventory, and incoming shipments to recommend purchase orders. If inventory will run low before scheduled shipments arrive, it alerts purchasing teams automatically.
This evolution from single-purpose tracker to comprehensive logistics operating system happens incrementally. You don’t need to build everything at once. Start with core tracking functionality. Add modules as you identify needs.
Imagine.bo’s approach to logistics applications treats your initial app as a foundation, not a finished product. Each new module leverages existing data structures and business logic, making expansions faster than building from scratch.
Build vs. Buy vs. Spreadsheet—The True Cost Analysis
Understanding the real cost of supply chain visibility requires looking beyond sticker prices.
| Approach | Upfront Cost | Monthly Cost | Time to Launch | Customization | Scalability | Hidden Costs |
|---|---|---|---|---|---|---|
| Excel Spreadsheets | $0 | $0 | 1 week | High (manual) | Low | Staff time ($15K-30K/year), Error costs (variable), Opportunity costs |
| Off-the-Shelf SaaS | $0-$5K | $500-$5K | 2-4 weeks | Low | Medium | Integration fees, Per-user charges, Limited customization |
| Custom Dev Shop | $50K-$200K | $2K-$10K | 3-6 months | High | High | Maintenance, Bug fixes, Feature updates |
| Imagine.bo | $0 | $9-$249 | 1 afternoon | High | High | Minimal—included in subscription |
Excel’s Hidden Costs: A logistics coordinator spending 10 hours weekly on manual tracking represents $15K-30K annually in fully-loaded labor costs. Error costs vary but are real—one missed delay notification that damages a customer relationship can cost 100x more than software subscription fees. The biggest cost is opportunity cost: while your team updates spreadsheets, competitors with automated systems are optimizing routes and preventing delays.
Off-the-Shelf SaaS Limitations: Enterprise supply chain platforms like Fourkites or Project44 cost $3K-10K monthly and require you to adapt your processes to their data model. They work well if your needs match their feature set exactly. When they don’t—and they rarely do—you’re stuck with workarounds. Integration fees add up when connecting to ERP systems, warehouse management platforms, and carrier APIs. Per-user pricing means costs scale linearly with team growth.
Custom Development Reality: A traditional development shop quotes $80K and four months for a basic track-and-trace system. That’s the optimistic scenario. Requirements change during development. APIs don’t work as documented. Delays push timelines to six months and budgets to $120K. After launch, you need ongoing maintenance—bug fixes, security updates, and feature additions. Monthly retainers range from $2K-10K depending on support level.
Imagine.bo’s Value Proposition: AI-powered app building delivers custom-built, production-grade software at SaaS pricing. Your initial build takes hours instead of months. Iteration happens through conversation, not change orders and sprint planning. Monthly subscription includes hosting, security updates, scaling infrastructure, and ongoing support.
According to Kodiak Hub’s build-versus-buy analysis, the breakeven point for custom development typically requires 3+ years of operational savings. With AI-generated apps, you reach breakeven in months because development costs are 100x lower.
Real-World Example: A mid-sized distributor evaluated options for replacing Excel-based tracking:
- SaaS platform quote: $4,500/month ($54K annually)
- Custom development quote: $95K upfront + $3K/month maintenance
- Imagine.bo solution: $9/month
They built their Imagine.bo tracker in two days. Three months later, they had added inventory integration, customer portal, and automated reporting—features the SaaS platform didn’t offer and the custom dev shop quoted at an additional $40K. Total first-year cost: $3,588 versus $54K (SaaS) or $131K (custom dev).
The question isn’t whether to invest in supply chain visibility. The question is whether to spend $50K-100K building what you need or $3K building it yourself in an afternoon.
Conclusion: From Static Rows to Intelligent Operations
Supply chain management deserves better than Excel rows and manual updates.
Your competitive advantage in logistics doesn’t come from having the lowest shipping rates or the fastest carriers. It comes from visibility—knowing exactly where everything is, predicting what might go wrong, and taking action before problems become crises.
Traditional approaches force you to choose: Accept the limitations of spreadsheets and generic SaaS platforms, or invest six figures and six months building custom software. AI-powered app development eliminates that trade-off.
In a single afternoon, you can build a track-and-trace dashboard that connects to carrier APIs, displays live location data, predicts delays using historical patterns, and alerts your team automatically when shipments need attention. You own the code. You control the data. You customize everything.
Your supply chain tracker becomes the foundation for a complete logistics operating system. Add inventory management. Build carrier scorecards. Create customer portals. Integrate with procurement workflows. Each expansion takes days, not months.
The 67% effectiveness loss that Slimstock documented for Excel-based tracking isn’t inevitable. It’s a choice. Companies that embrace purpose-built, AI-powered supply chain visibility operate faster, serve customers better, and scale without proportionally increasing operational overhead.
Your shipment doesn’t need to be a spreadsheet row anymore. Make it a live data point that drives intelligent action.
Start Building Your Supply Chain Tracker Today
Ready to move beyond spreadsheets?
Next Steps:
- Try Imagine.bo: Sign up for free and describe your supply chain tracking needs in plain English. See how quickly AI translates your requirements into working software.
- Explore Related Resources:
- AI Supply Chain Optimization Tools — Learn how AI predicts disruptions and optimizes routing
- No-Code Guide for Logistics & Automotive — Industry-specific applications and case studies
- Building Your First AI App — Step-by-step tutorial for first-time builders
- See It In Action: Watch a 5-minute demo of a track-and-trace dashboard being built from a simple prompt to fully functional application.
The transformation from reactive firefighting to proactive supply chain management starts with one afternoon and one conversation with an AI that understands your business.
Frequently Asked Questions
How long does it really take to build a supply chain tracker with Imagine.bo?
Initial dashboard creation takes 2-4 hours, depending on complexity. This includes describing your requirements, reviewing the generated architecture, and refining the interface. Adding advanced features like AI predictions or carrier API integrations adds another 1-2 hours. Compare this to 3-6 months for traditional custom development or 2-4 weeks implementing enterprise SaaS platforms.
Do I need to know how to code?
Imagine.bo uses conversational prompts to understand your requirements and generates production-grade code automatically. You describe what you want in plain English—the AI handles database design, backend logic, API integrations, and frontend development. If you can explain your supply chain process to a colleague, you can build a tracker.
Can I integrate with existing carrier APIs like FedEx and UPS?
Yes. Imagine.bo connects to carrier tracking APIs, freight forwarder systems, ERP platforms, and warehouse management systems. Describe which carriers you use and what data you need—the AI configures API connections, handles authentication, and sets up automated data synchronization. No manual API documentation reading required.
What’s the difference between this and Excel macros or Power BI dashboards?
Excel macros and Power BI create visualizations of existing data but don’t provide real-time connectivity, predictive intelligence, or automated workflows. They require manual data updates and lack mobile-optimized interfaces. Imagine.bo builds complete applications with live API connections, ML-powered predictions, automated alerts, and multi-user access controls—capabilities beyond spreadsheet tools.
How does AI predict shipment delays?
The system analyzes your historical shipment data to identify delay patterns based on carrier, route, season, package type, and other factors. When you create a new shipment, the trained ML model calculates a risk score by comparing its characteristics to historical patterns. For example, if shipments from Shanghai to Los Angeles via Carrier X experience 40% delays during December, new shipments matching those parameters receive high-risk scores.
Can I customize the dashboard after launch?
Absolutely. Customization happens through conversation. Tell Imagine.bo what you want to change—”Add a customer notification feature,” “Integrate with our Shopify store,” “Create a mobile app for warehouse staff”—and the AI